Tried and tested solutions for municipalities – ready to use straight away
Understanding and purposefully developing citiesWhich parts of my city are most vulnerable during heatwaves? How do our municipal CO₂ emissions look? Are schools and care services within easy reach for all citizens?
Many municipal challenges already have ready-made solutions in CIVORA - developed and tried in practice with municipalities such as Troisdorf, Augsburg and the KielRegion - ready for immediate reuse by your municipality.

Use Cases and Specialist Applications in CIVORA
Not every municipality needs to reinvent the wheelUse Cases
- No development process from scratch – ready to use straight away
- Saves considerable time, budget and staff resources
- Tried and tested in practice – developed together with municipalities
Specialist Applications
- Developed for statutory municipal tasks – ready and immediately deployable
- DKSR continuously maintains calculation bases, methodologies and legal requirements – your administration does not need to make adjustments
- No in-house development effort, no standards monitoring – we take care of that
For many municipal challenges, solutions already exist – fully developed, tried and tested, and directly reusable in CIVORA. See for yourself.
Energy
Energy and emissions monitoring
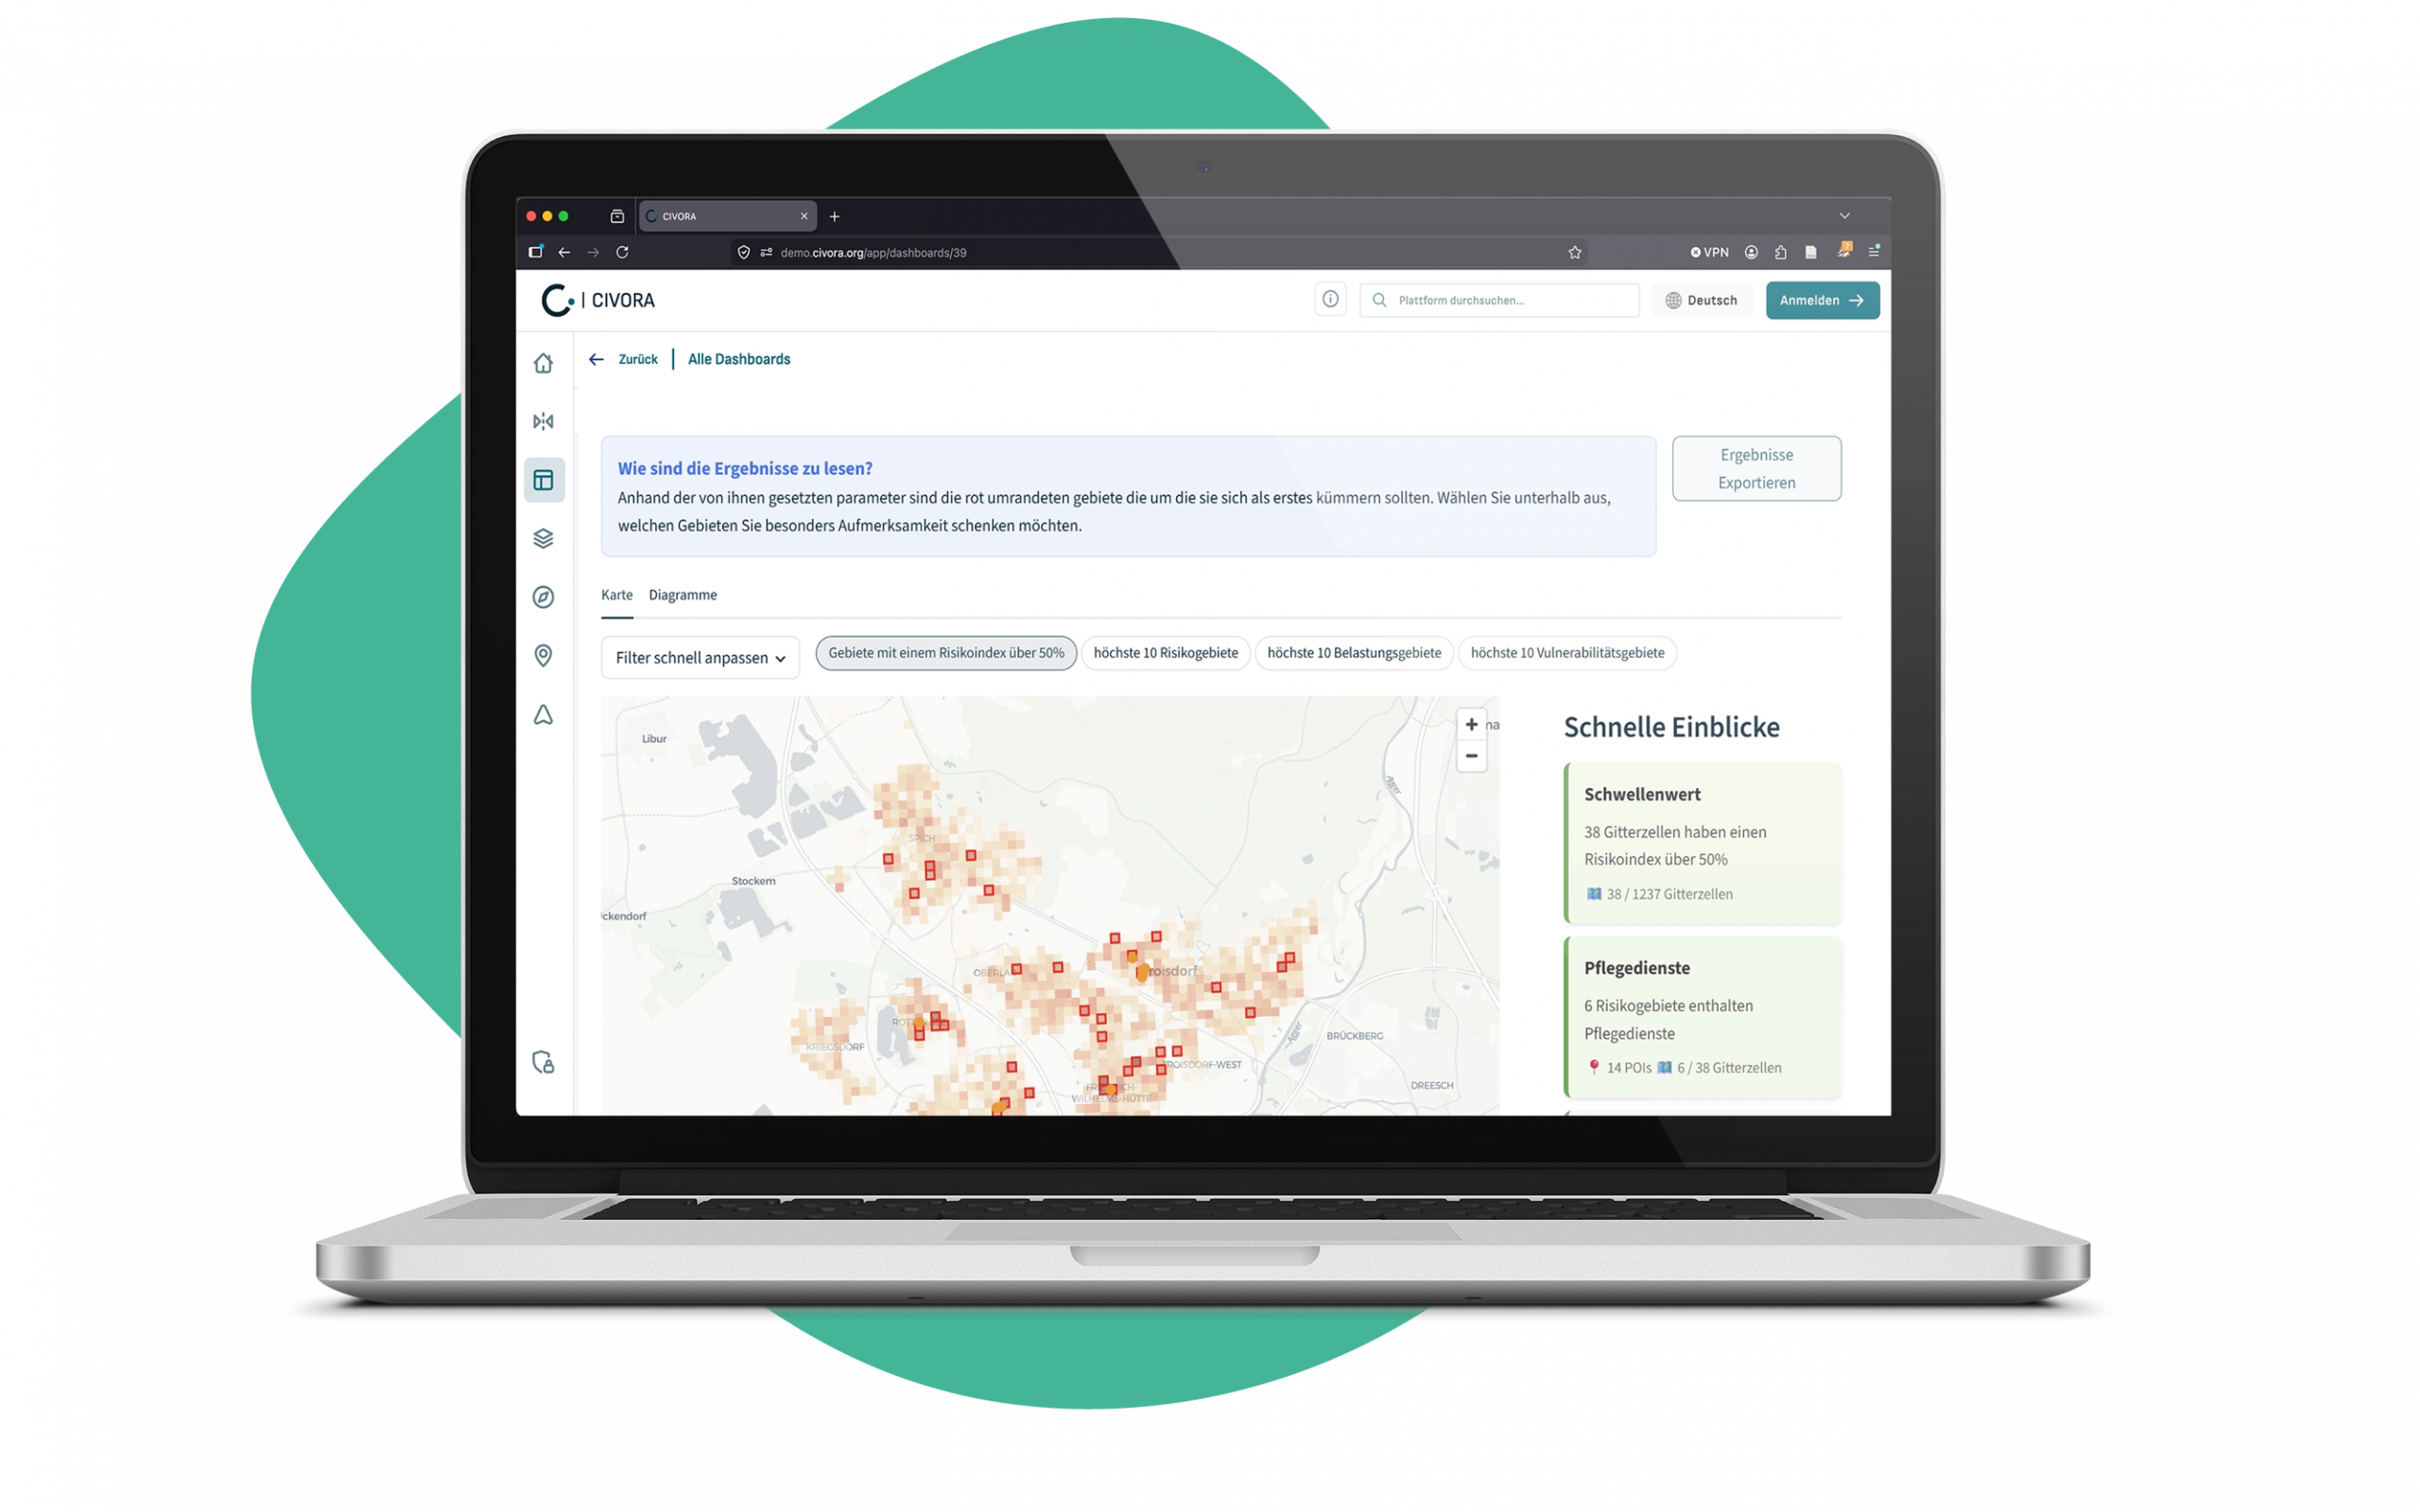
Use CaseWhere are the heat islands in your municipality? Which population groups are most vulnerable to heat? How long does it take those groups to reach a cool space from the hottest areas in your city? Or more broadly: What risk factors must you address in your heat action plan - and how? We help you compile, visualise, analyse and evaluate the data you need to answer these questions with confidence.
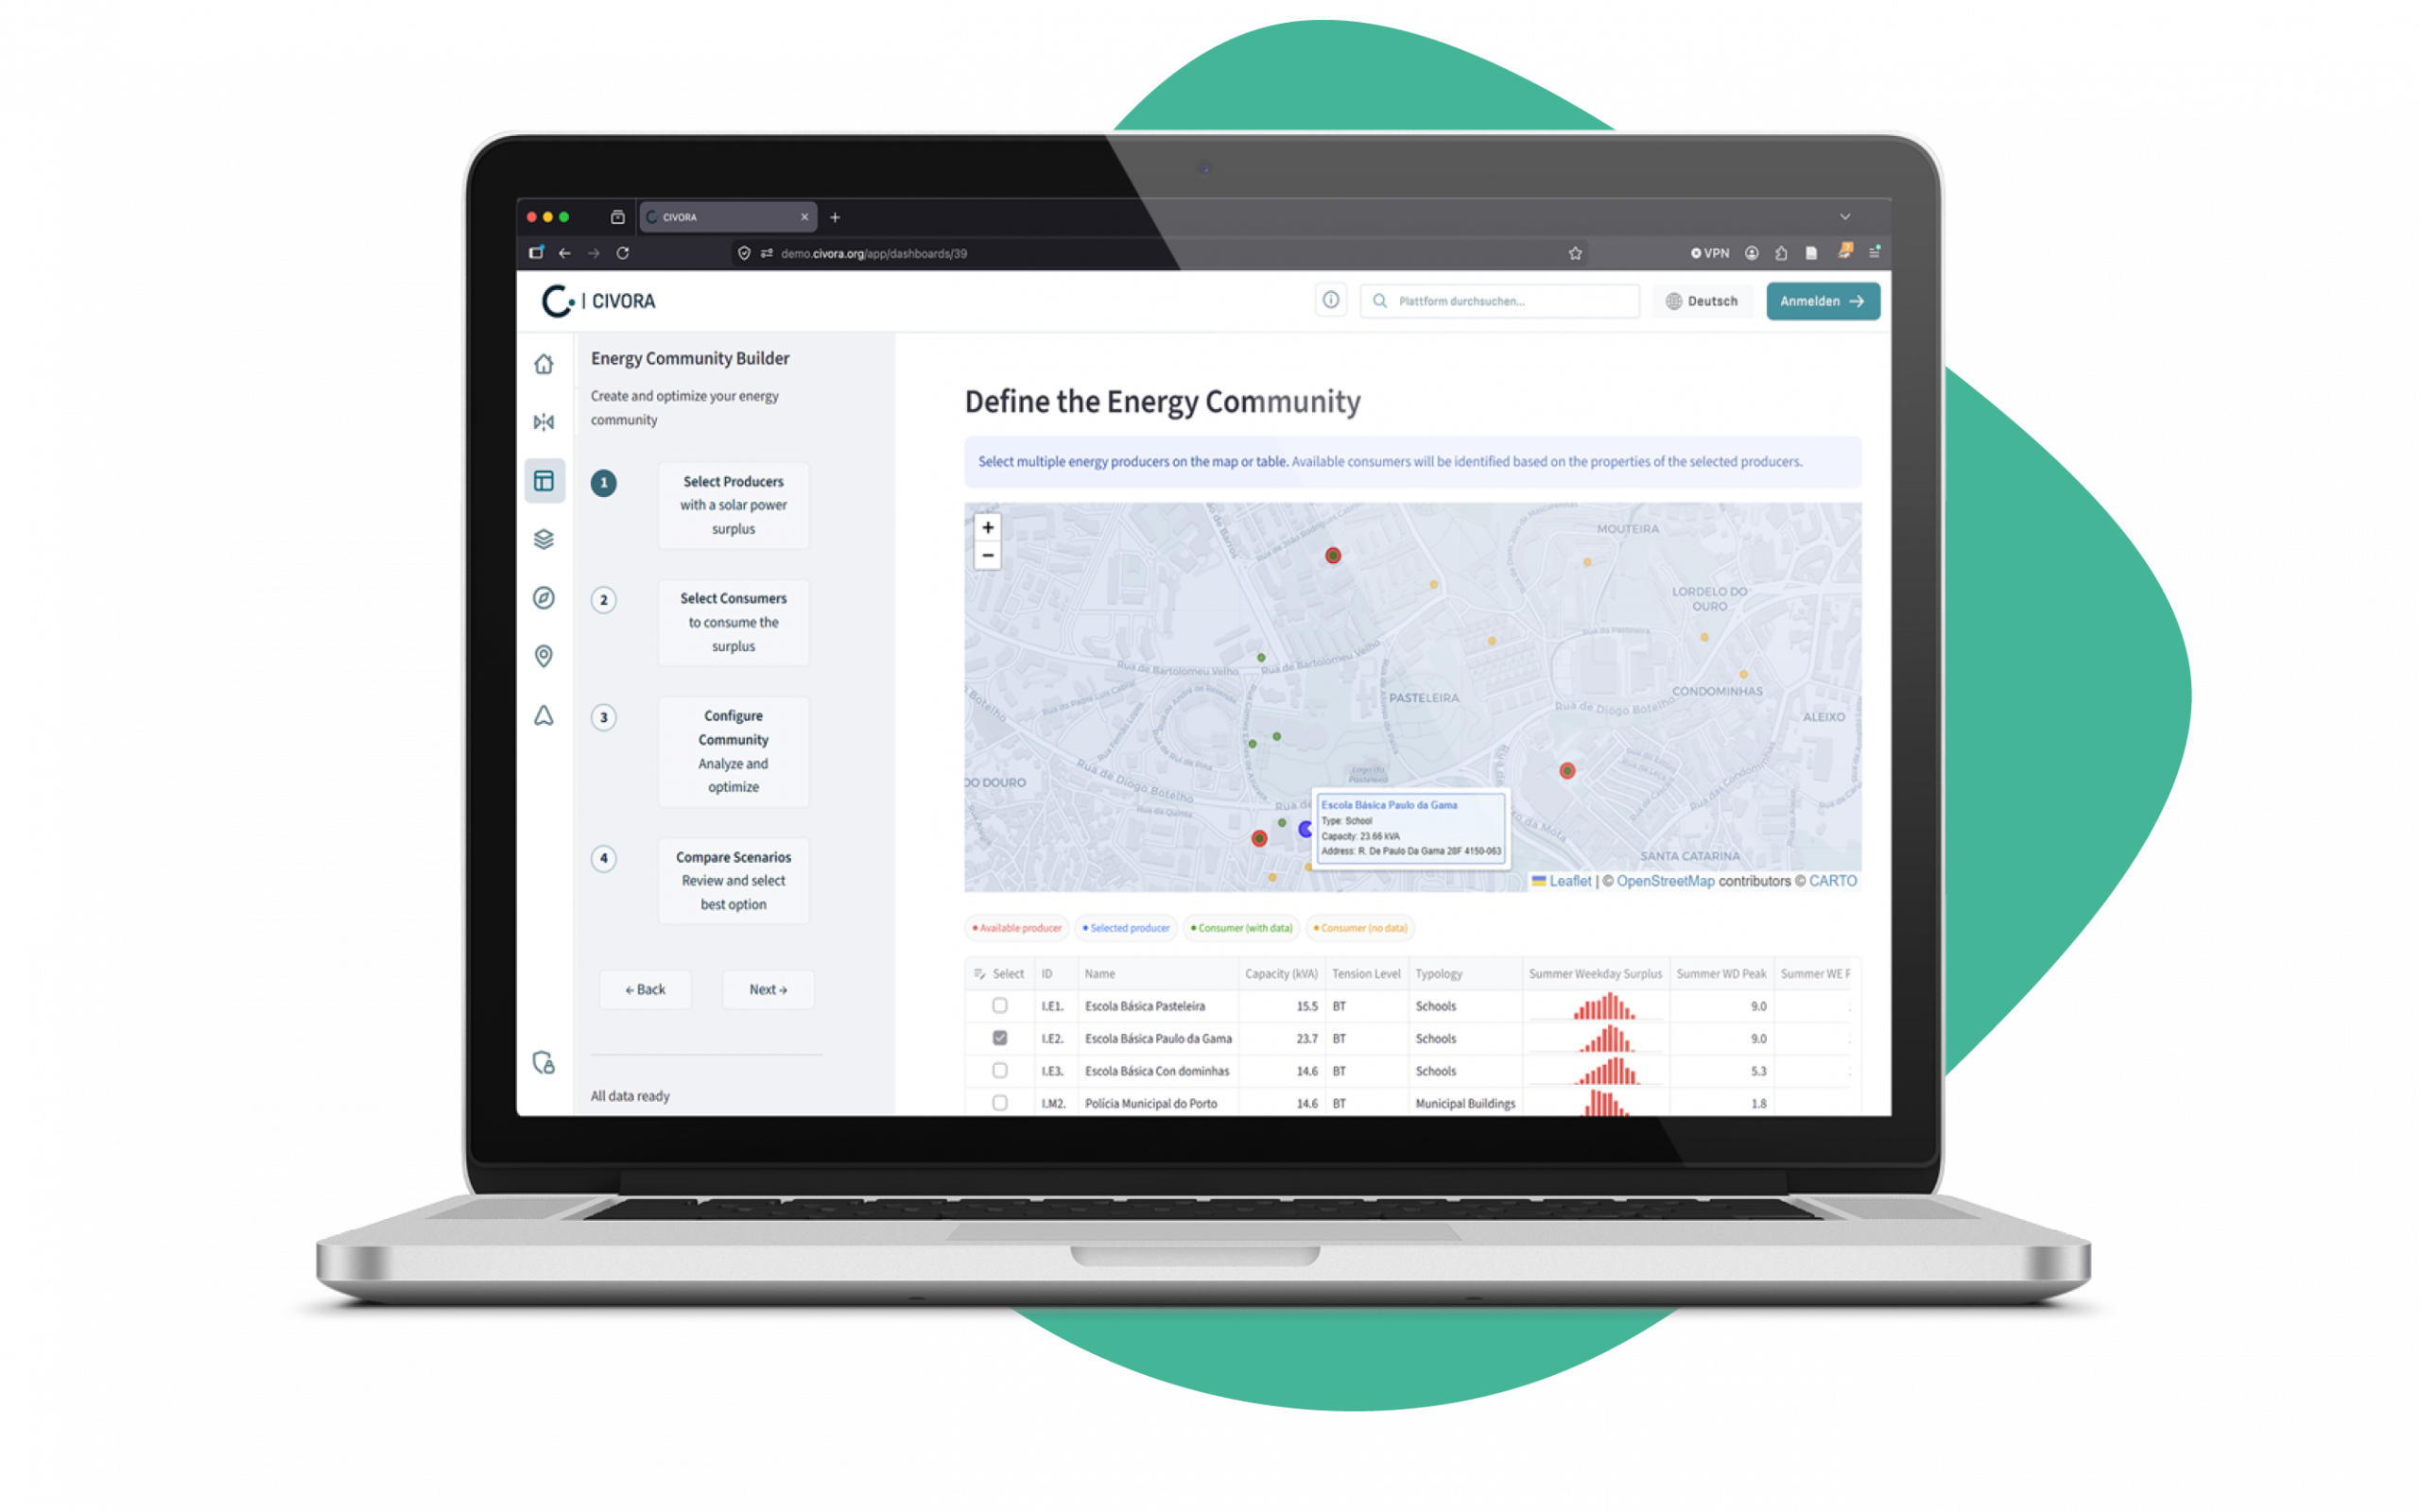
Energy-Community-Tool
Specialist application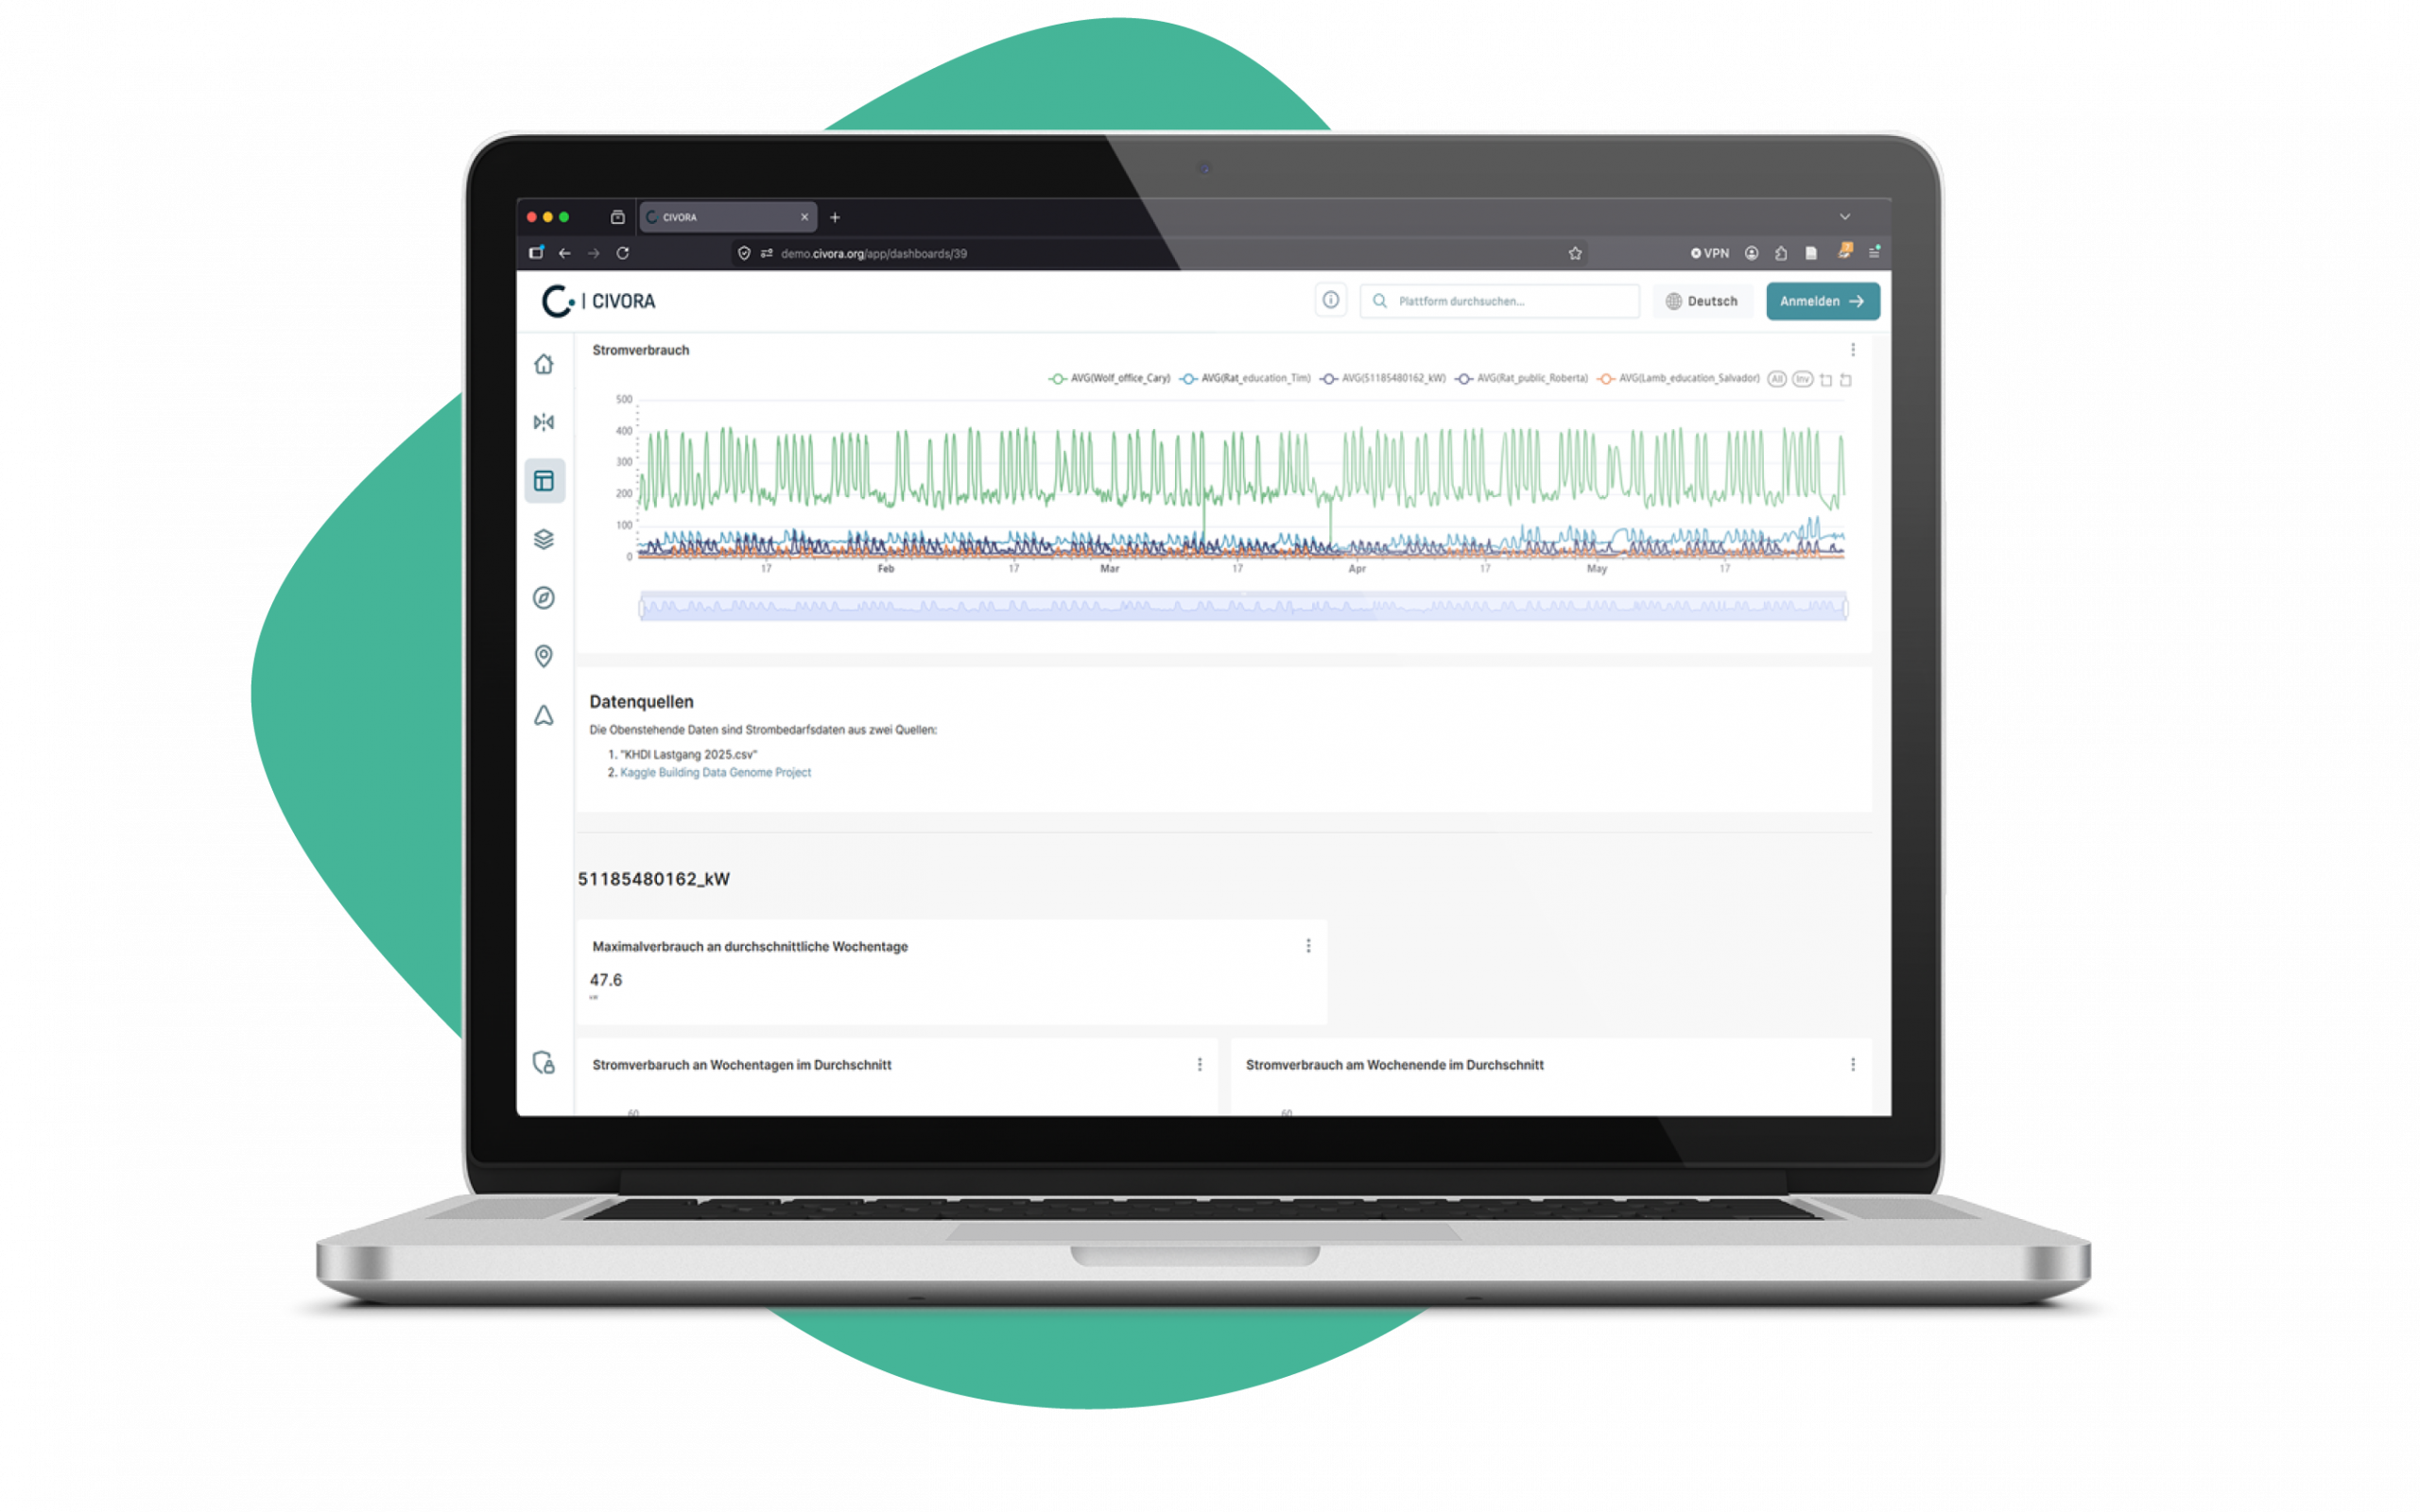
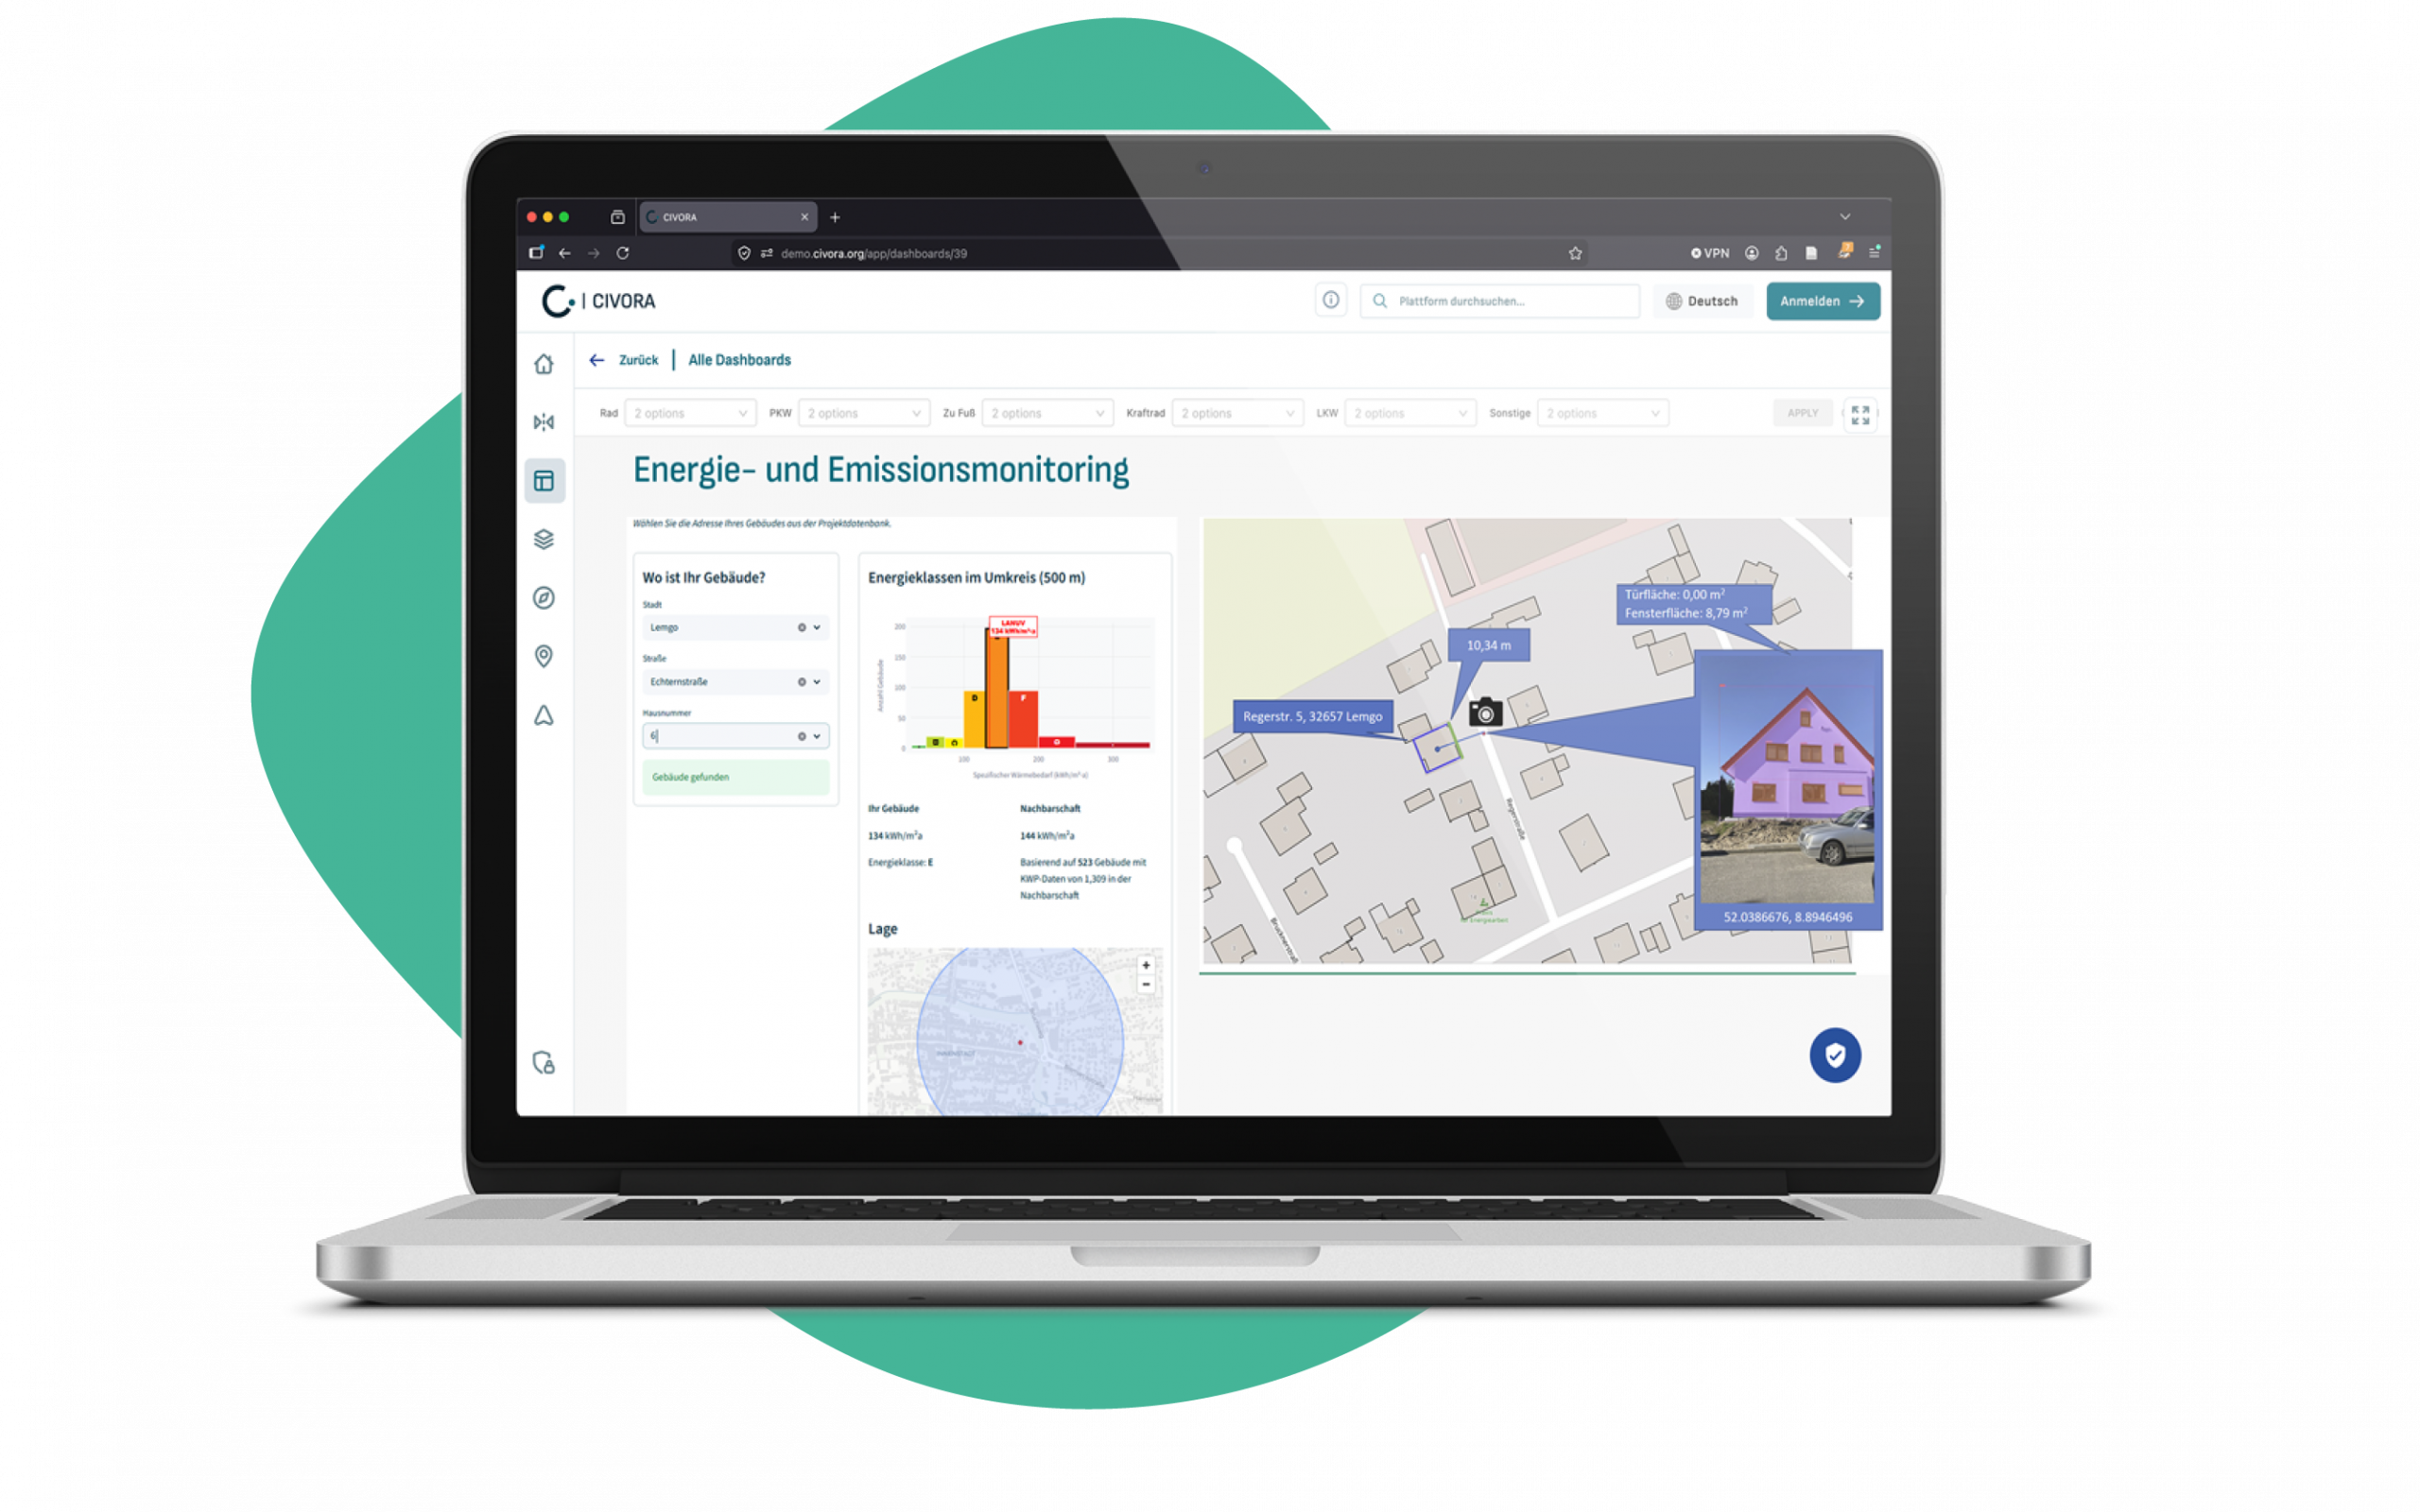
Digital Energy Adviser
Specialist applicationHow do you support citizens with energy-efficient retrofitting without adding to your advisory burden? The Digital Energy Adviser calculates personalised scenarios using official 3D geodata and AI-powered window detection from photos. Citizens get specific recommendations - including real costs and savings potential. The result: a lower barrier to retrofitting, less pressure on your advisory services, and an option for citizens to voluntarily contribute their data to municipal heat planning.
Climate
Heat Risk Filter
Use Case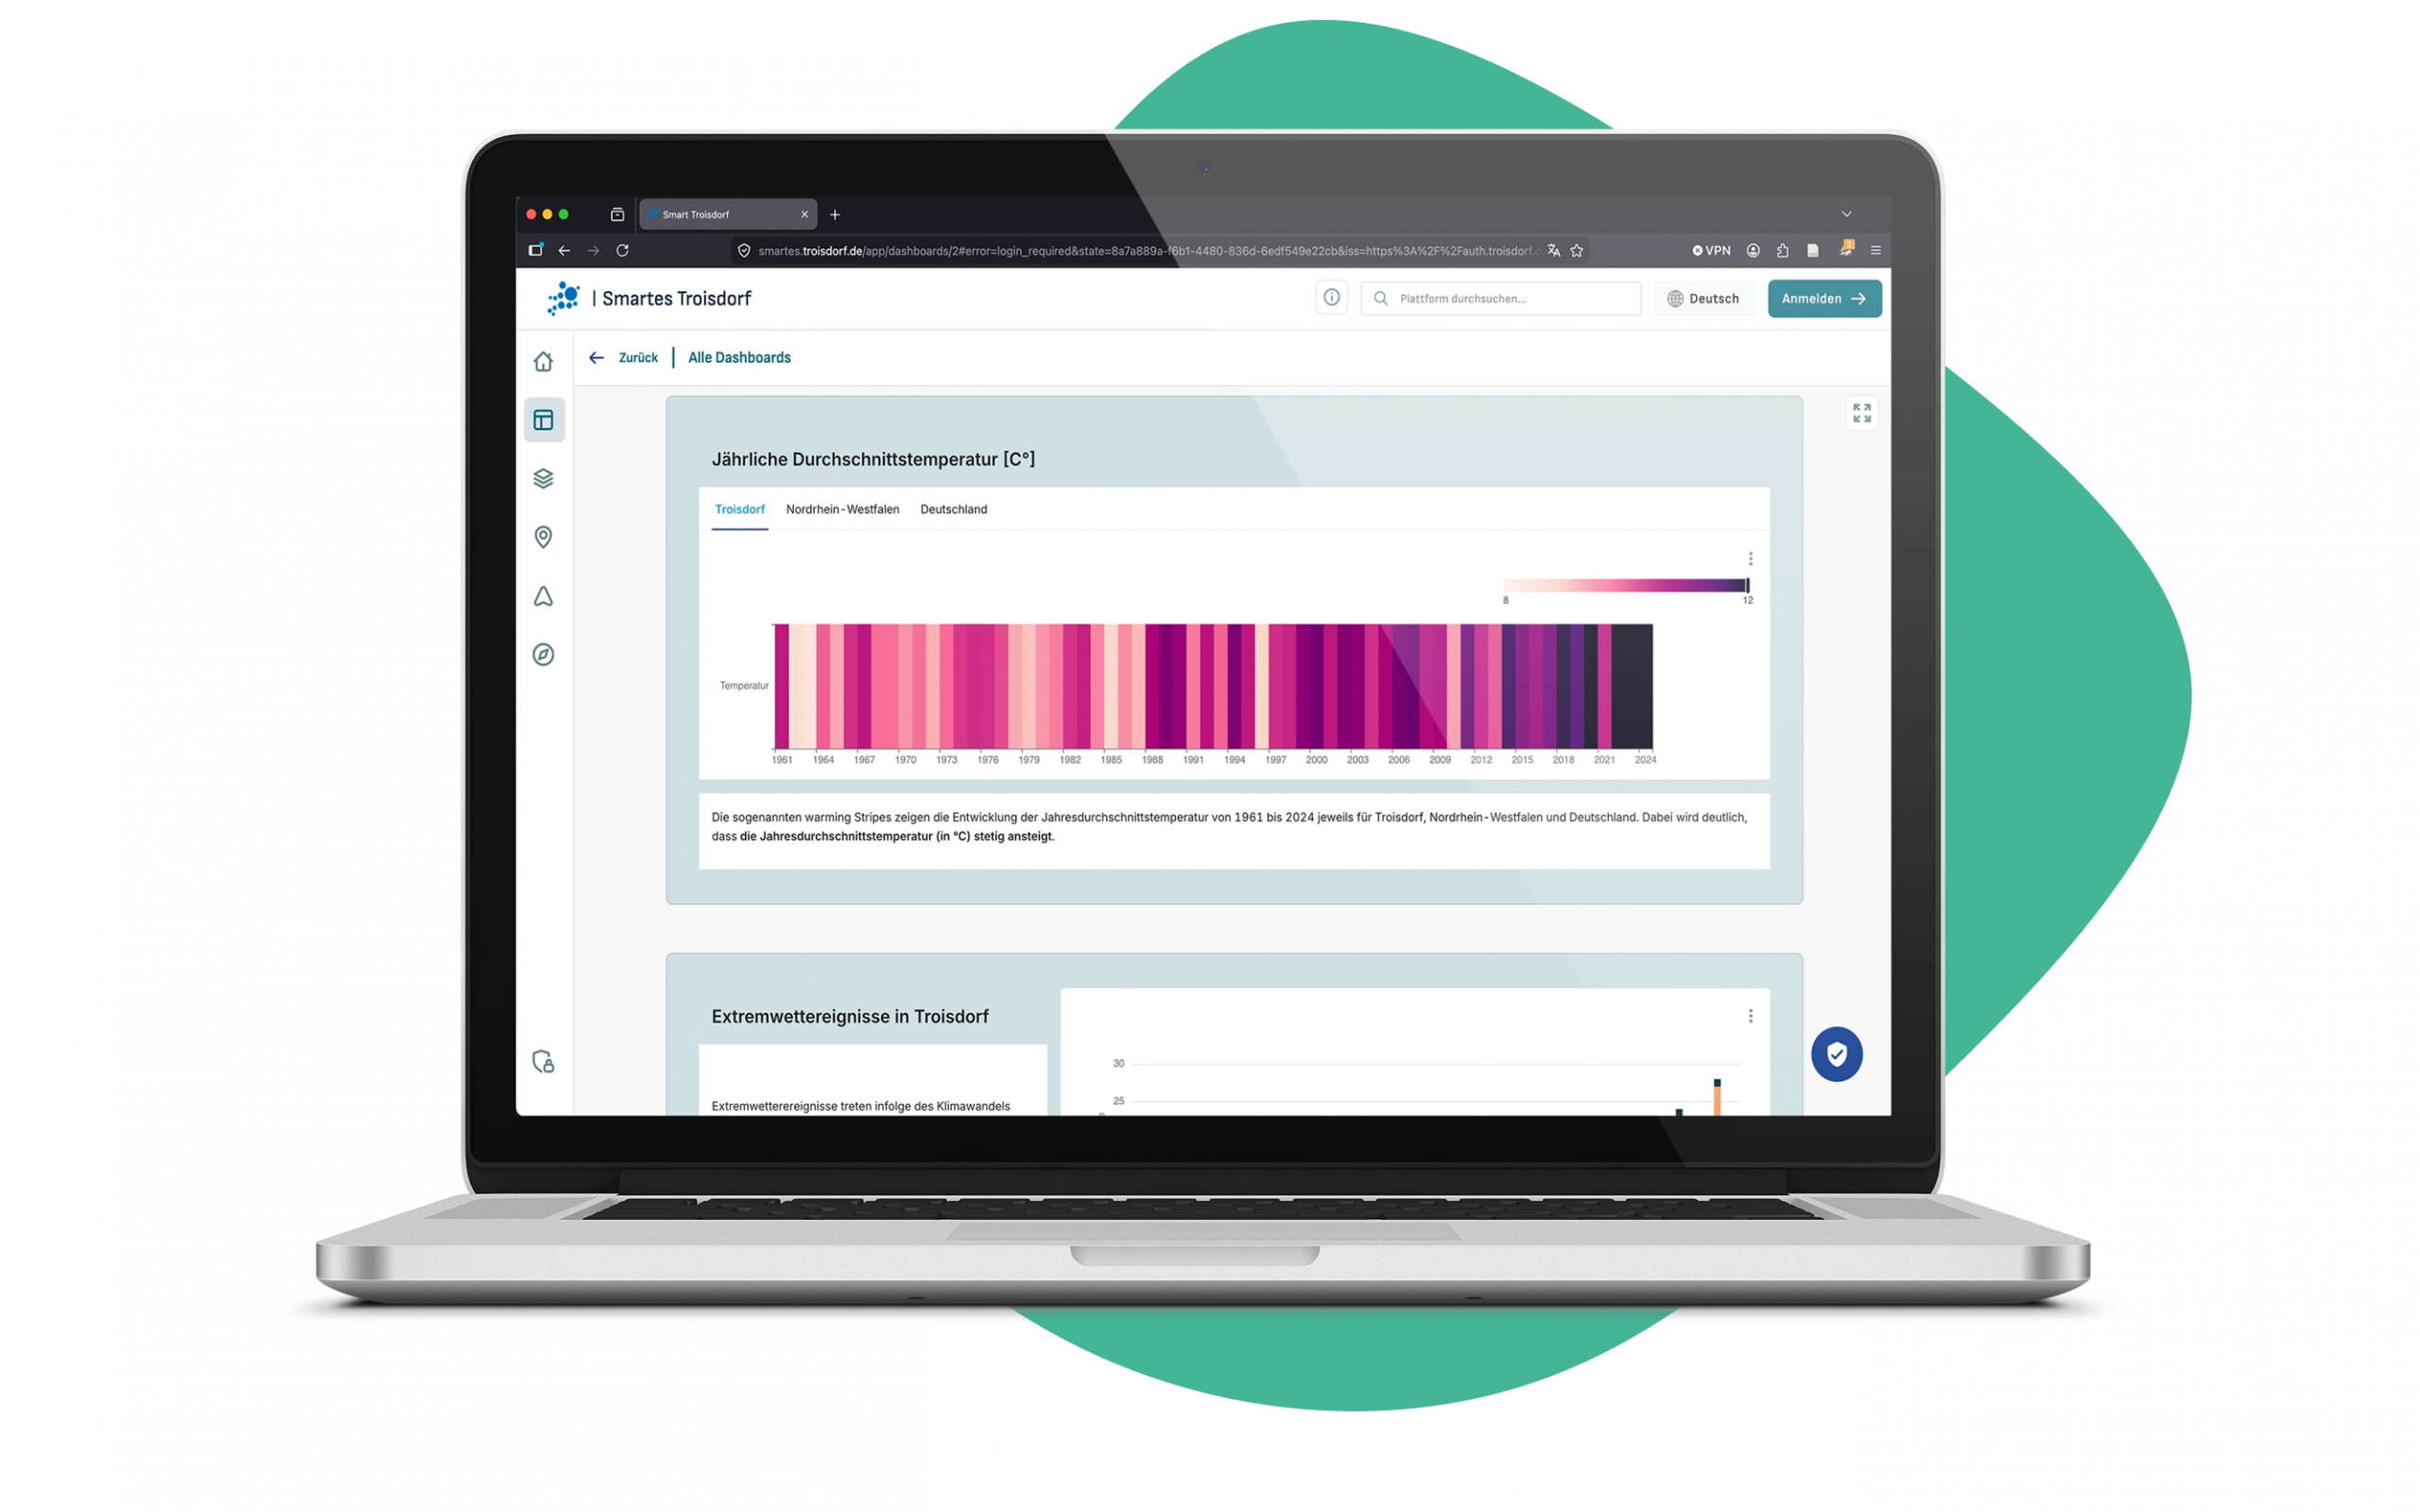
Climate Dashboard
Use Case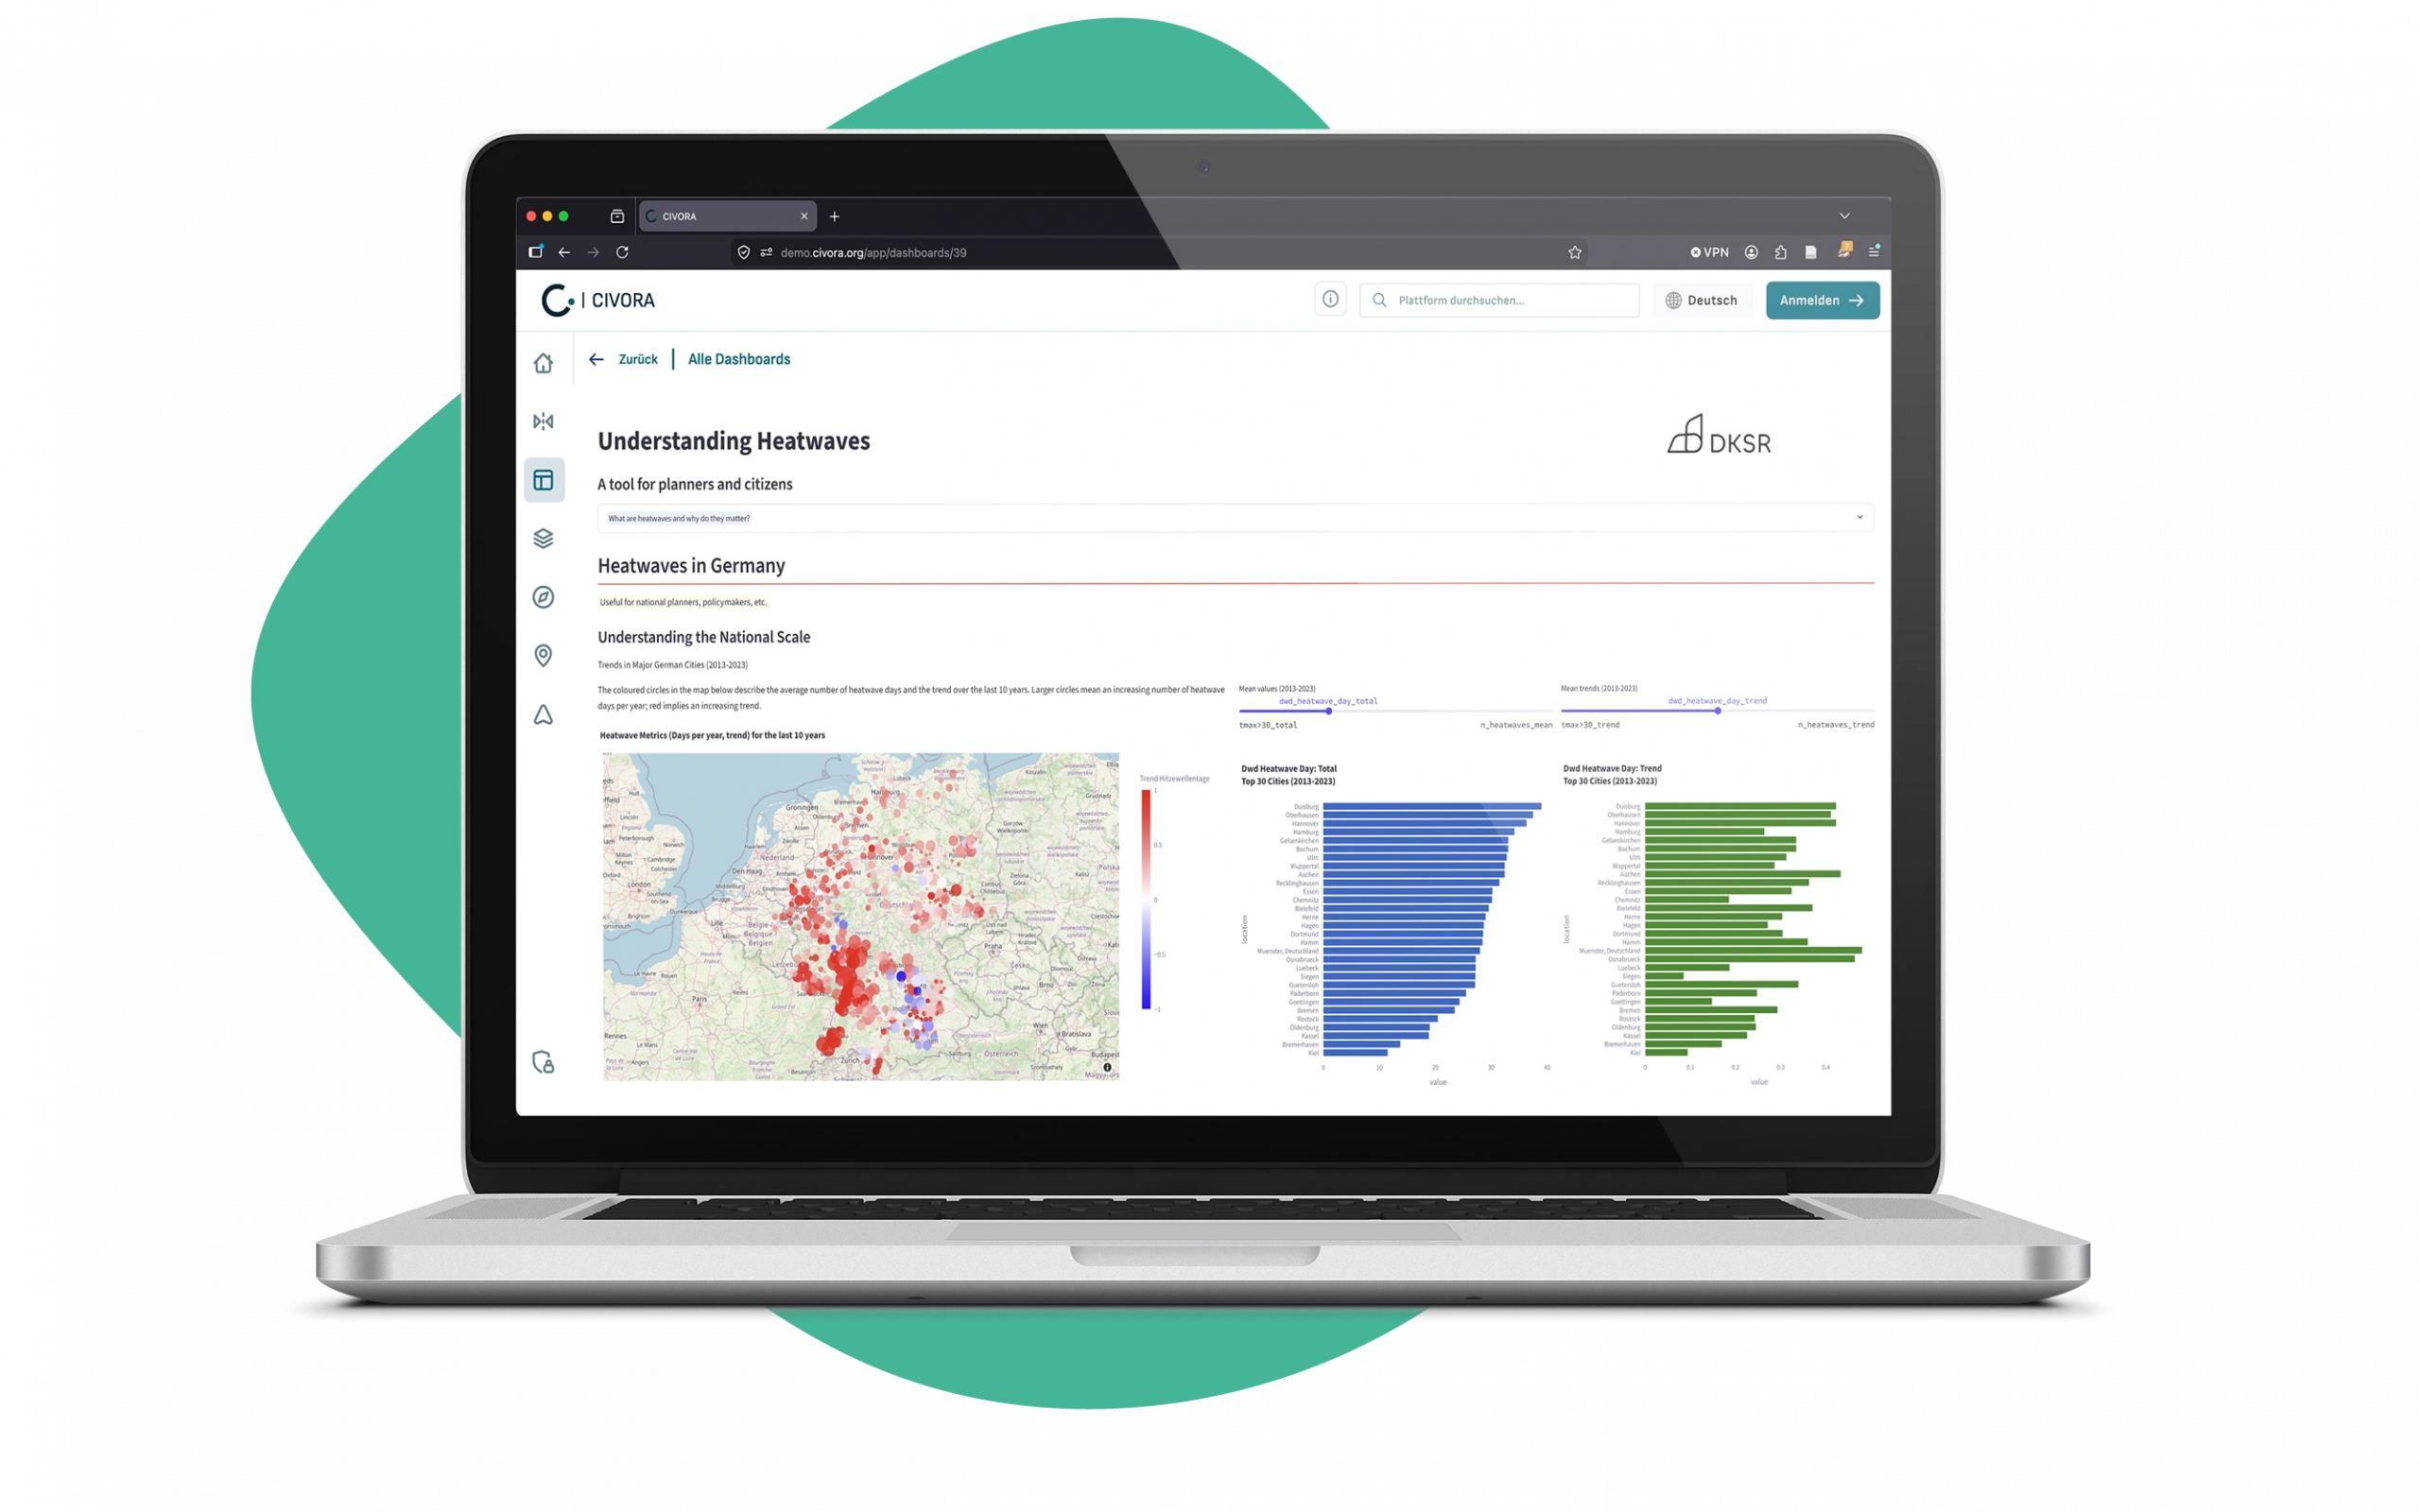
Understanding heat waves
Use CaseHow exceptional are the heat events in your region - and how do they fit into the global picture? The Heat Monitor analyses heat events from locations across the world and makes local events comparable in a global context. This creates a well-founded understanding of how severely your municipality is affected by climate change.
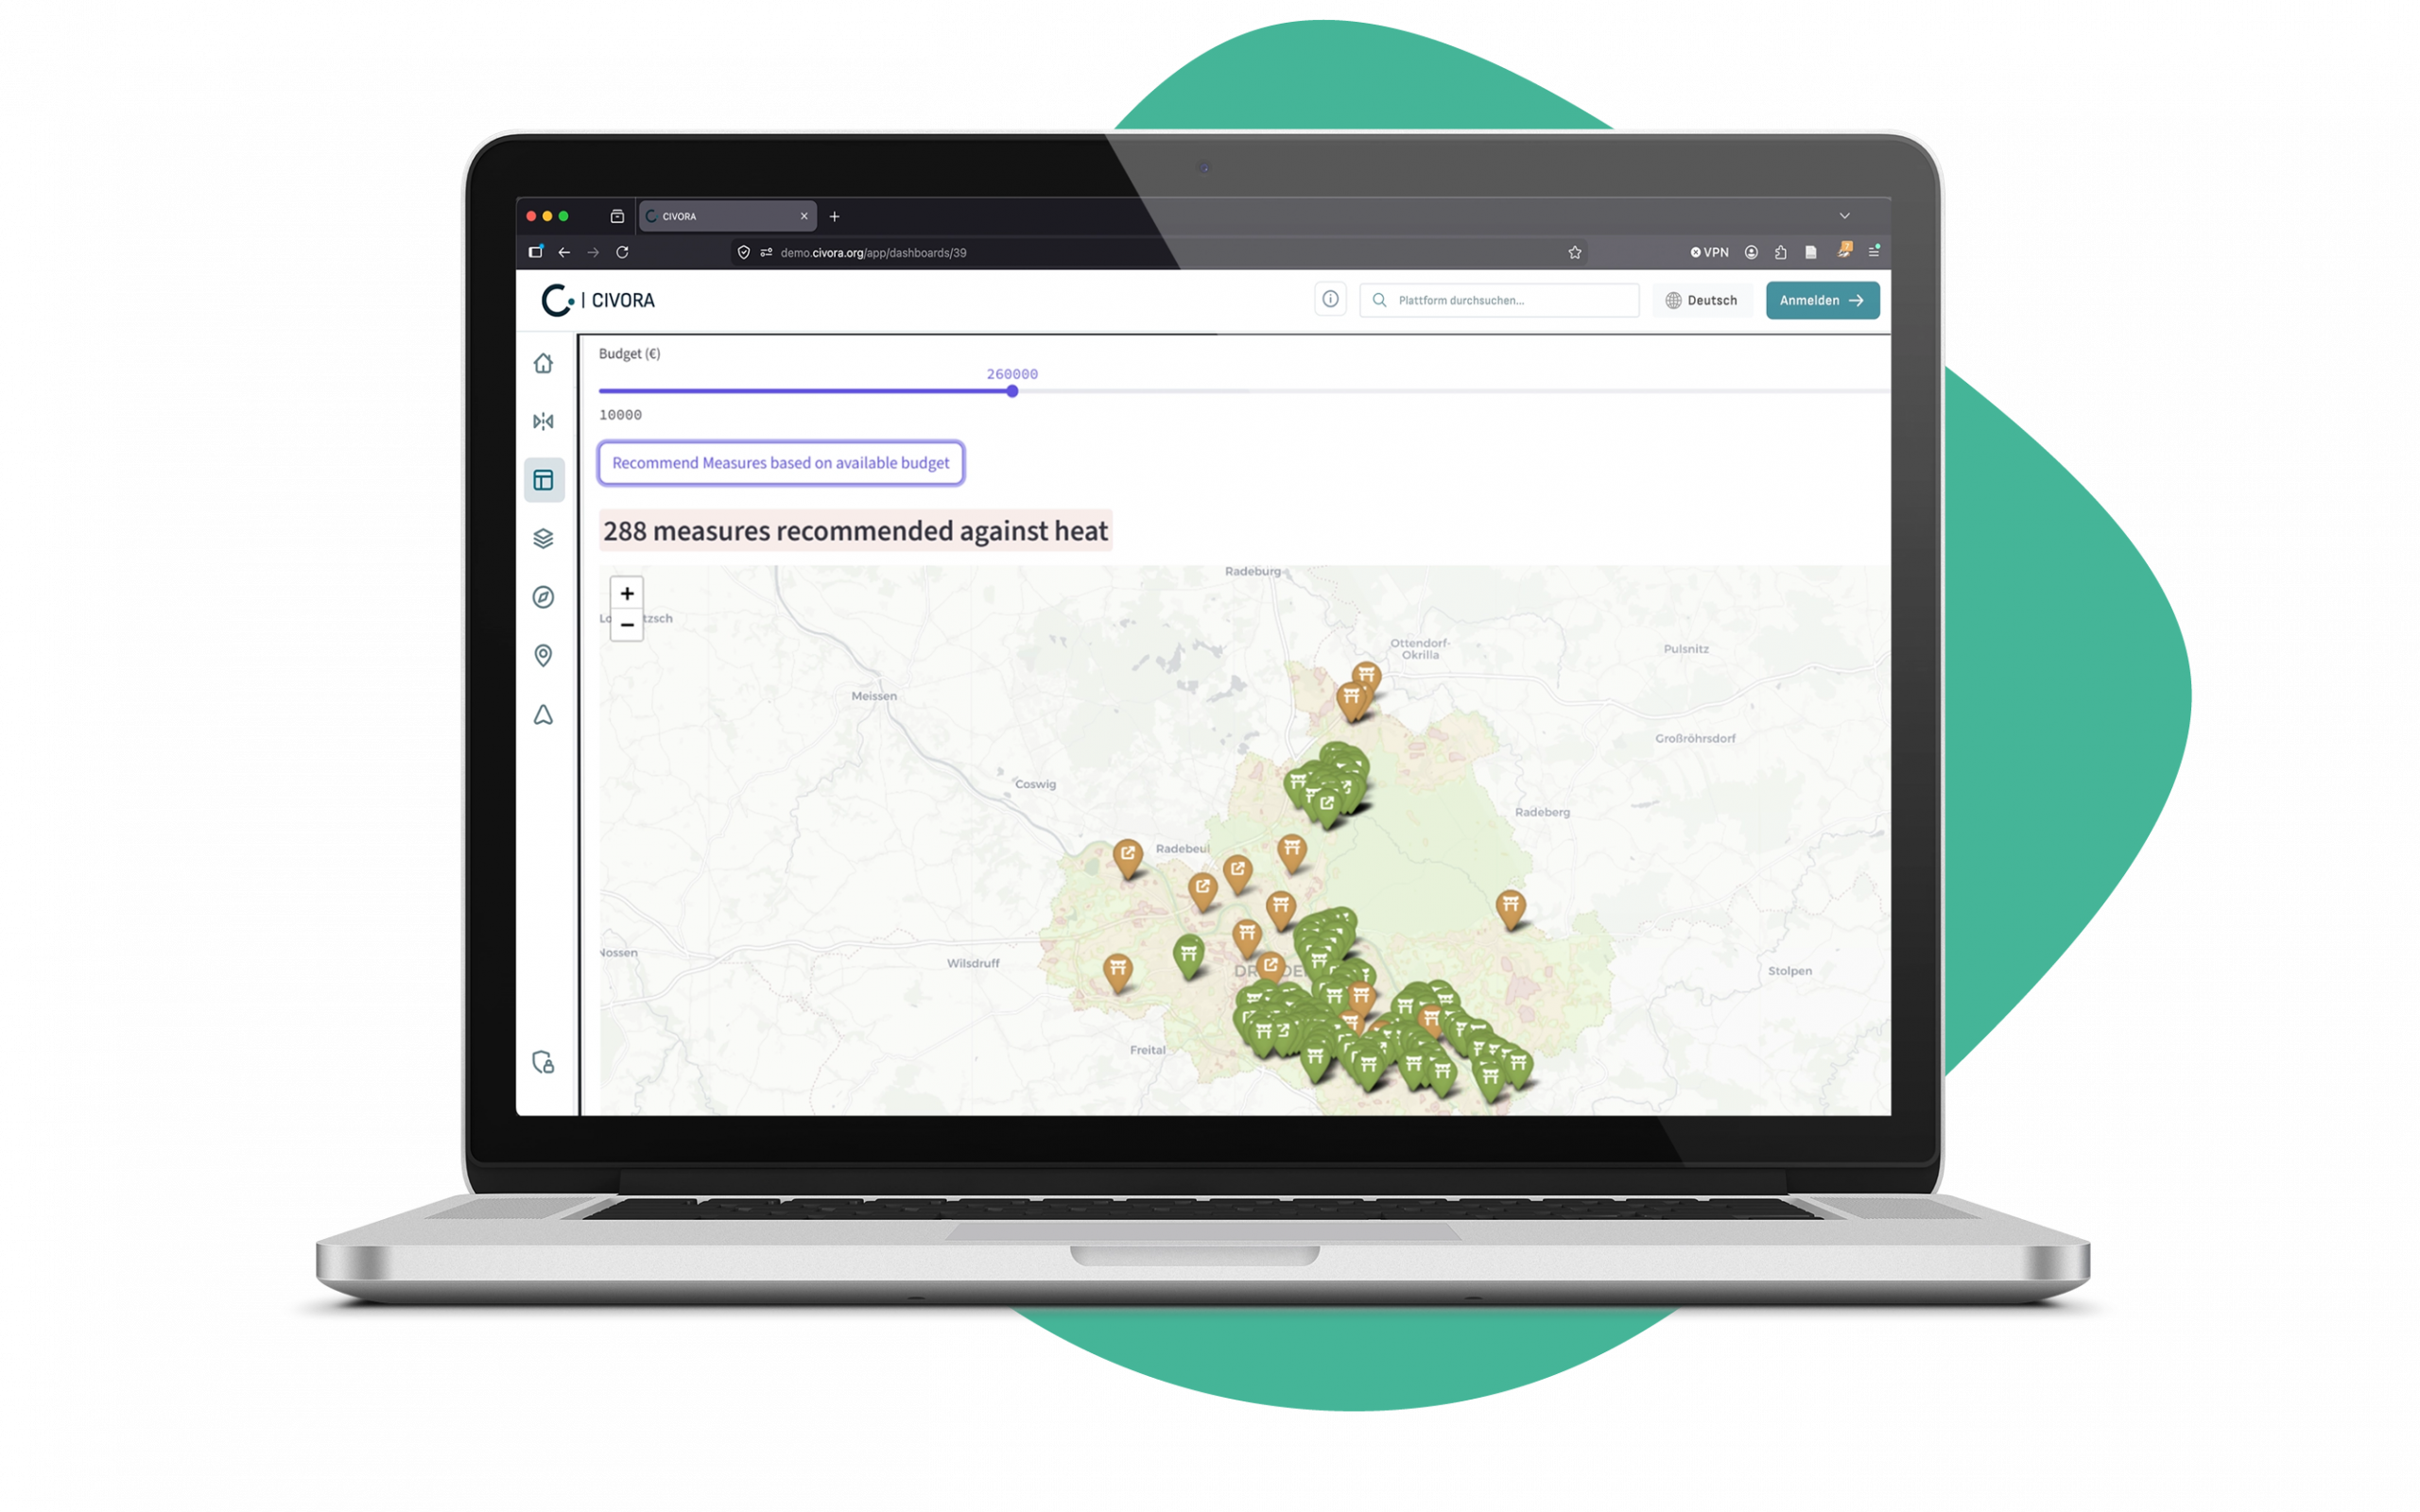
Heat Resilience Planner
Use CaseWhich heat protection measures are most effective – and where? The Heat Resilience Planner provides data-driven recommendations from your municipality's catalogue of measures, weighted by heat risk index, local conditions, costs and cooling effects. This allows you to deploy investments precisely where the need is greatest and the impact is highest – data-driven rather than gut instinct.
Mobility
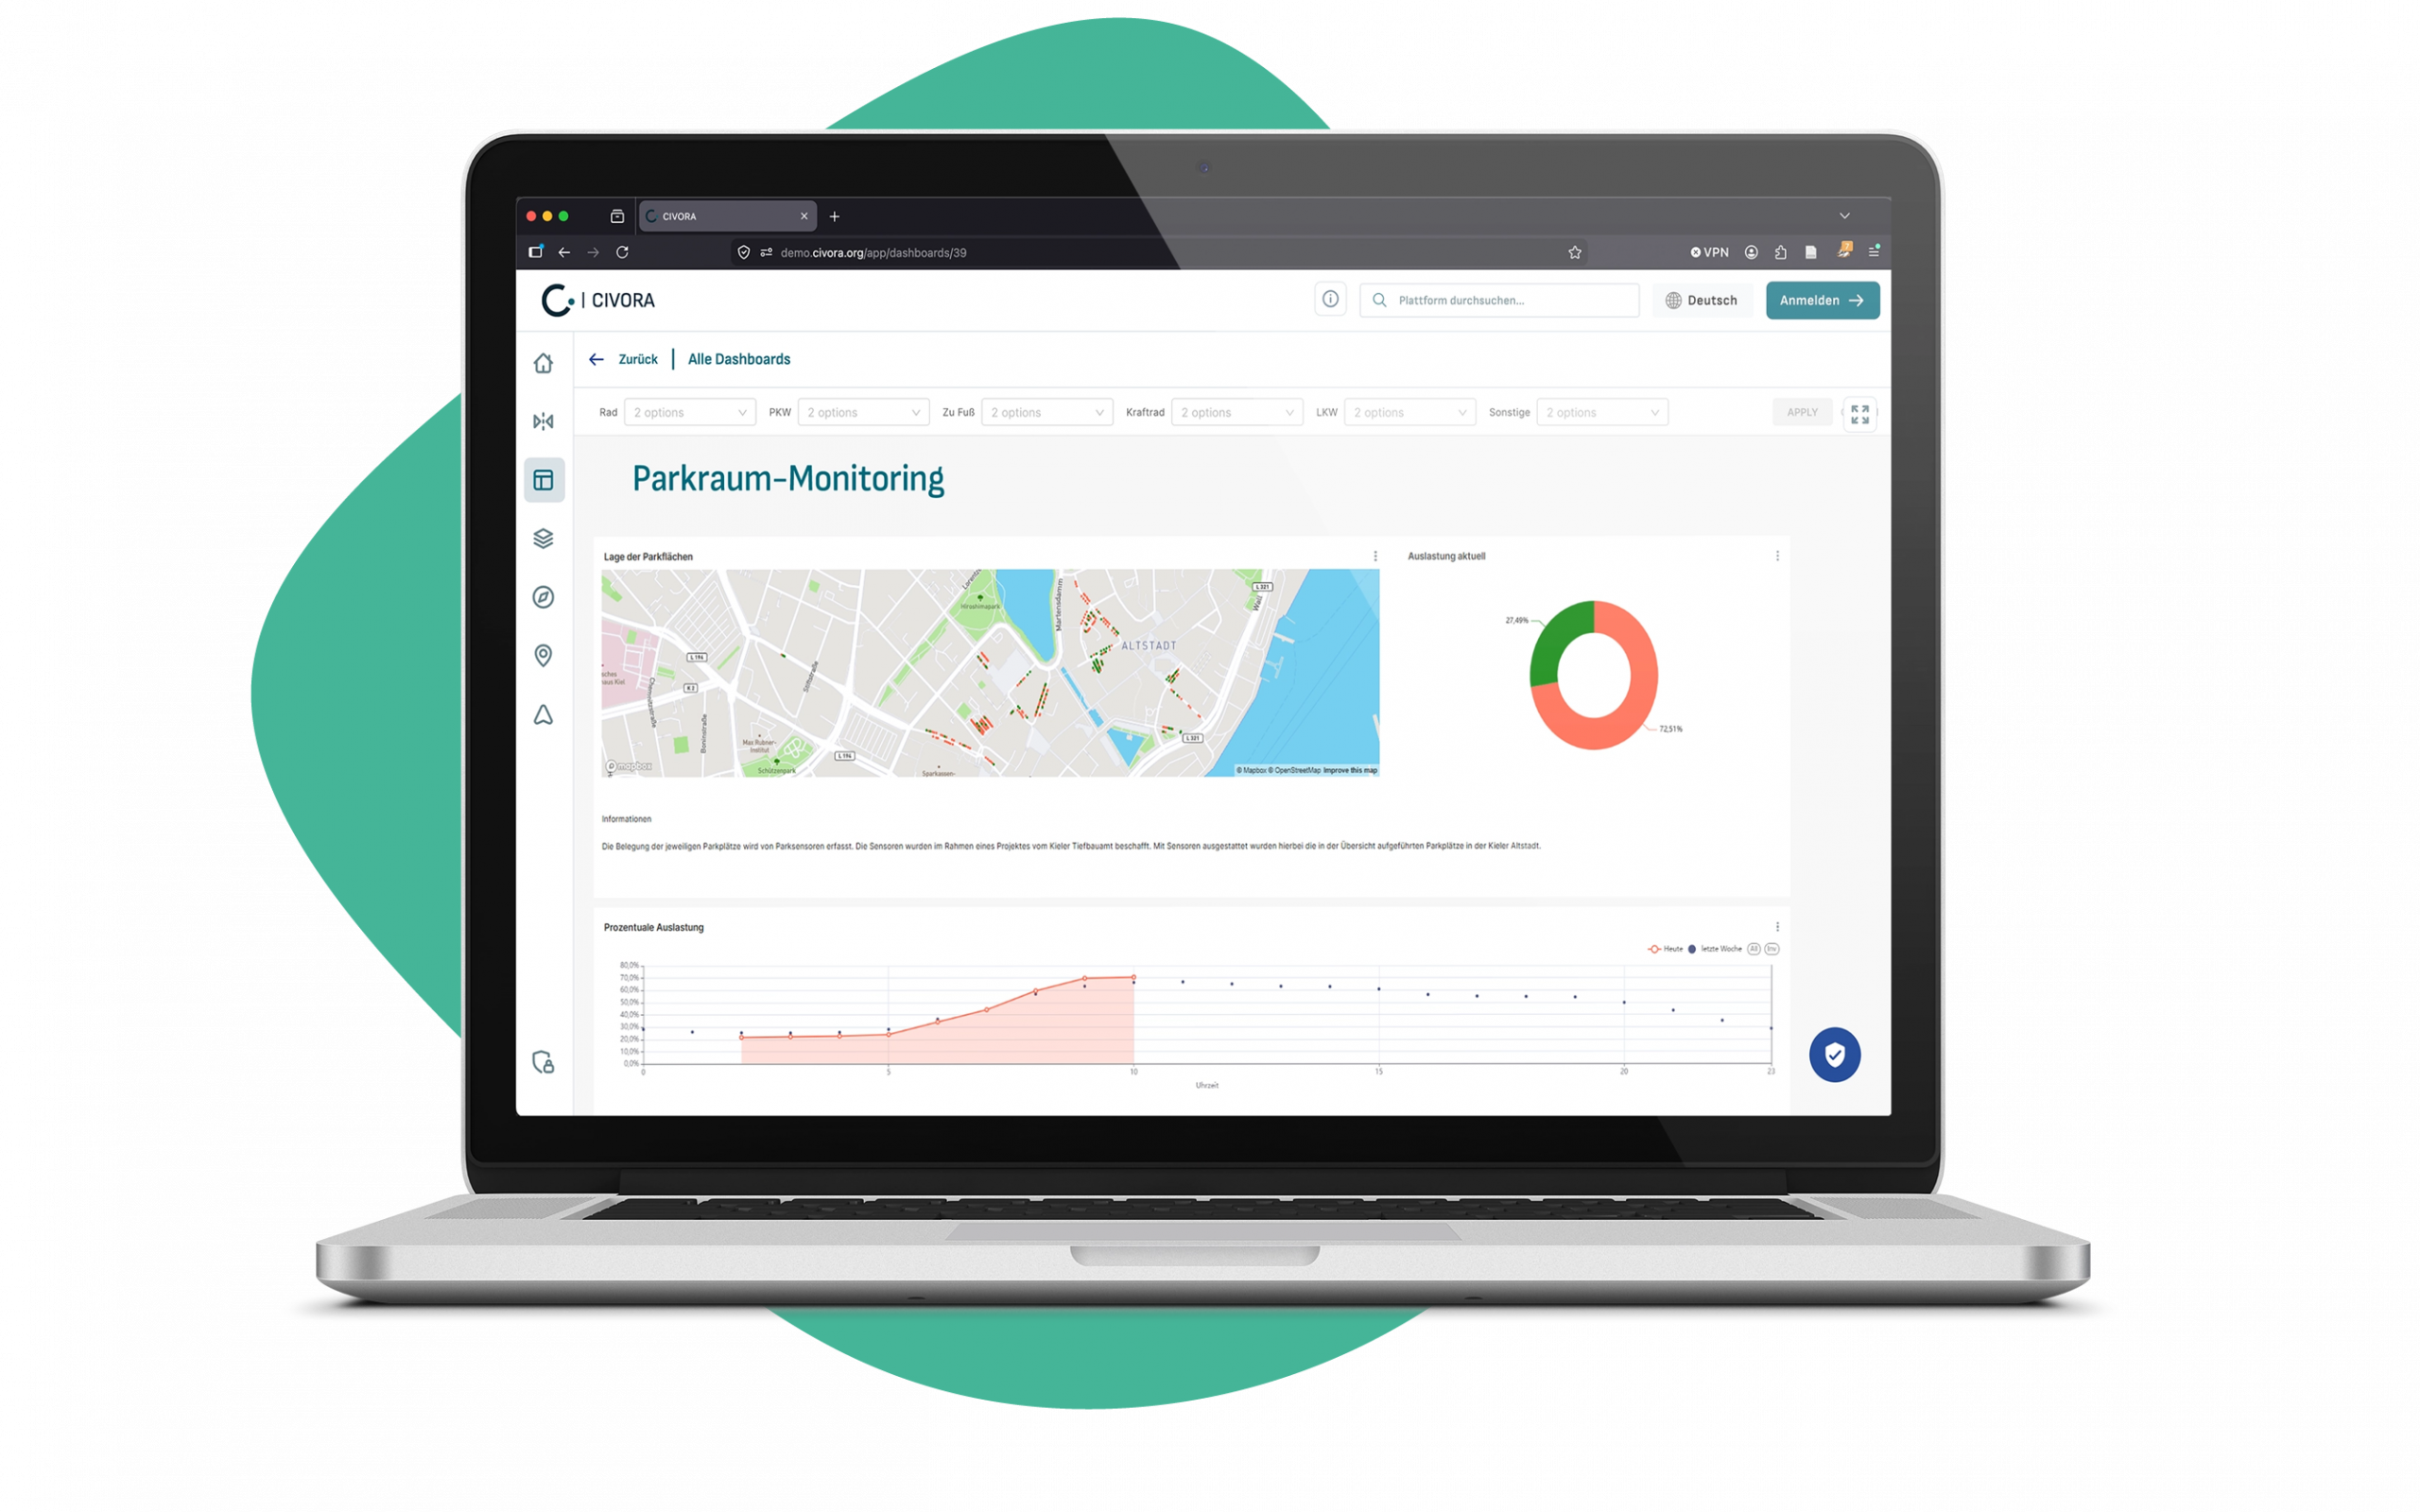
Parking Monitoring
Use Case
Black Ice Alert
Use Case
Footfall Analytics
Use Case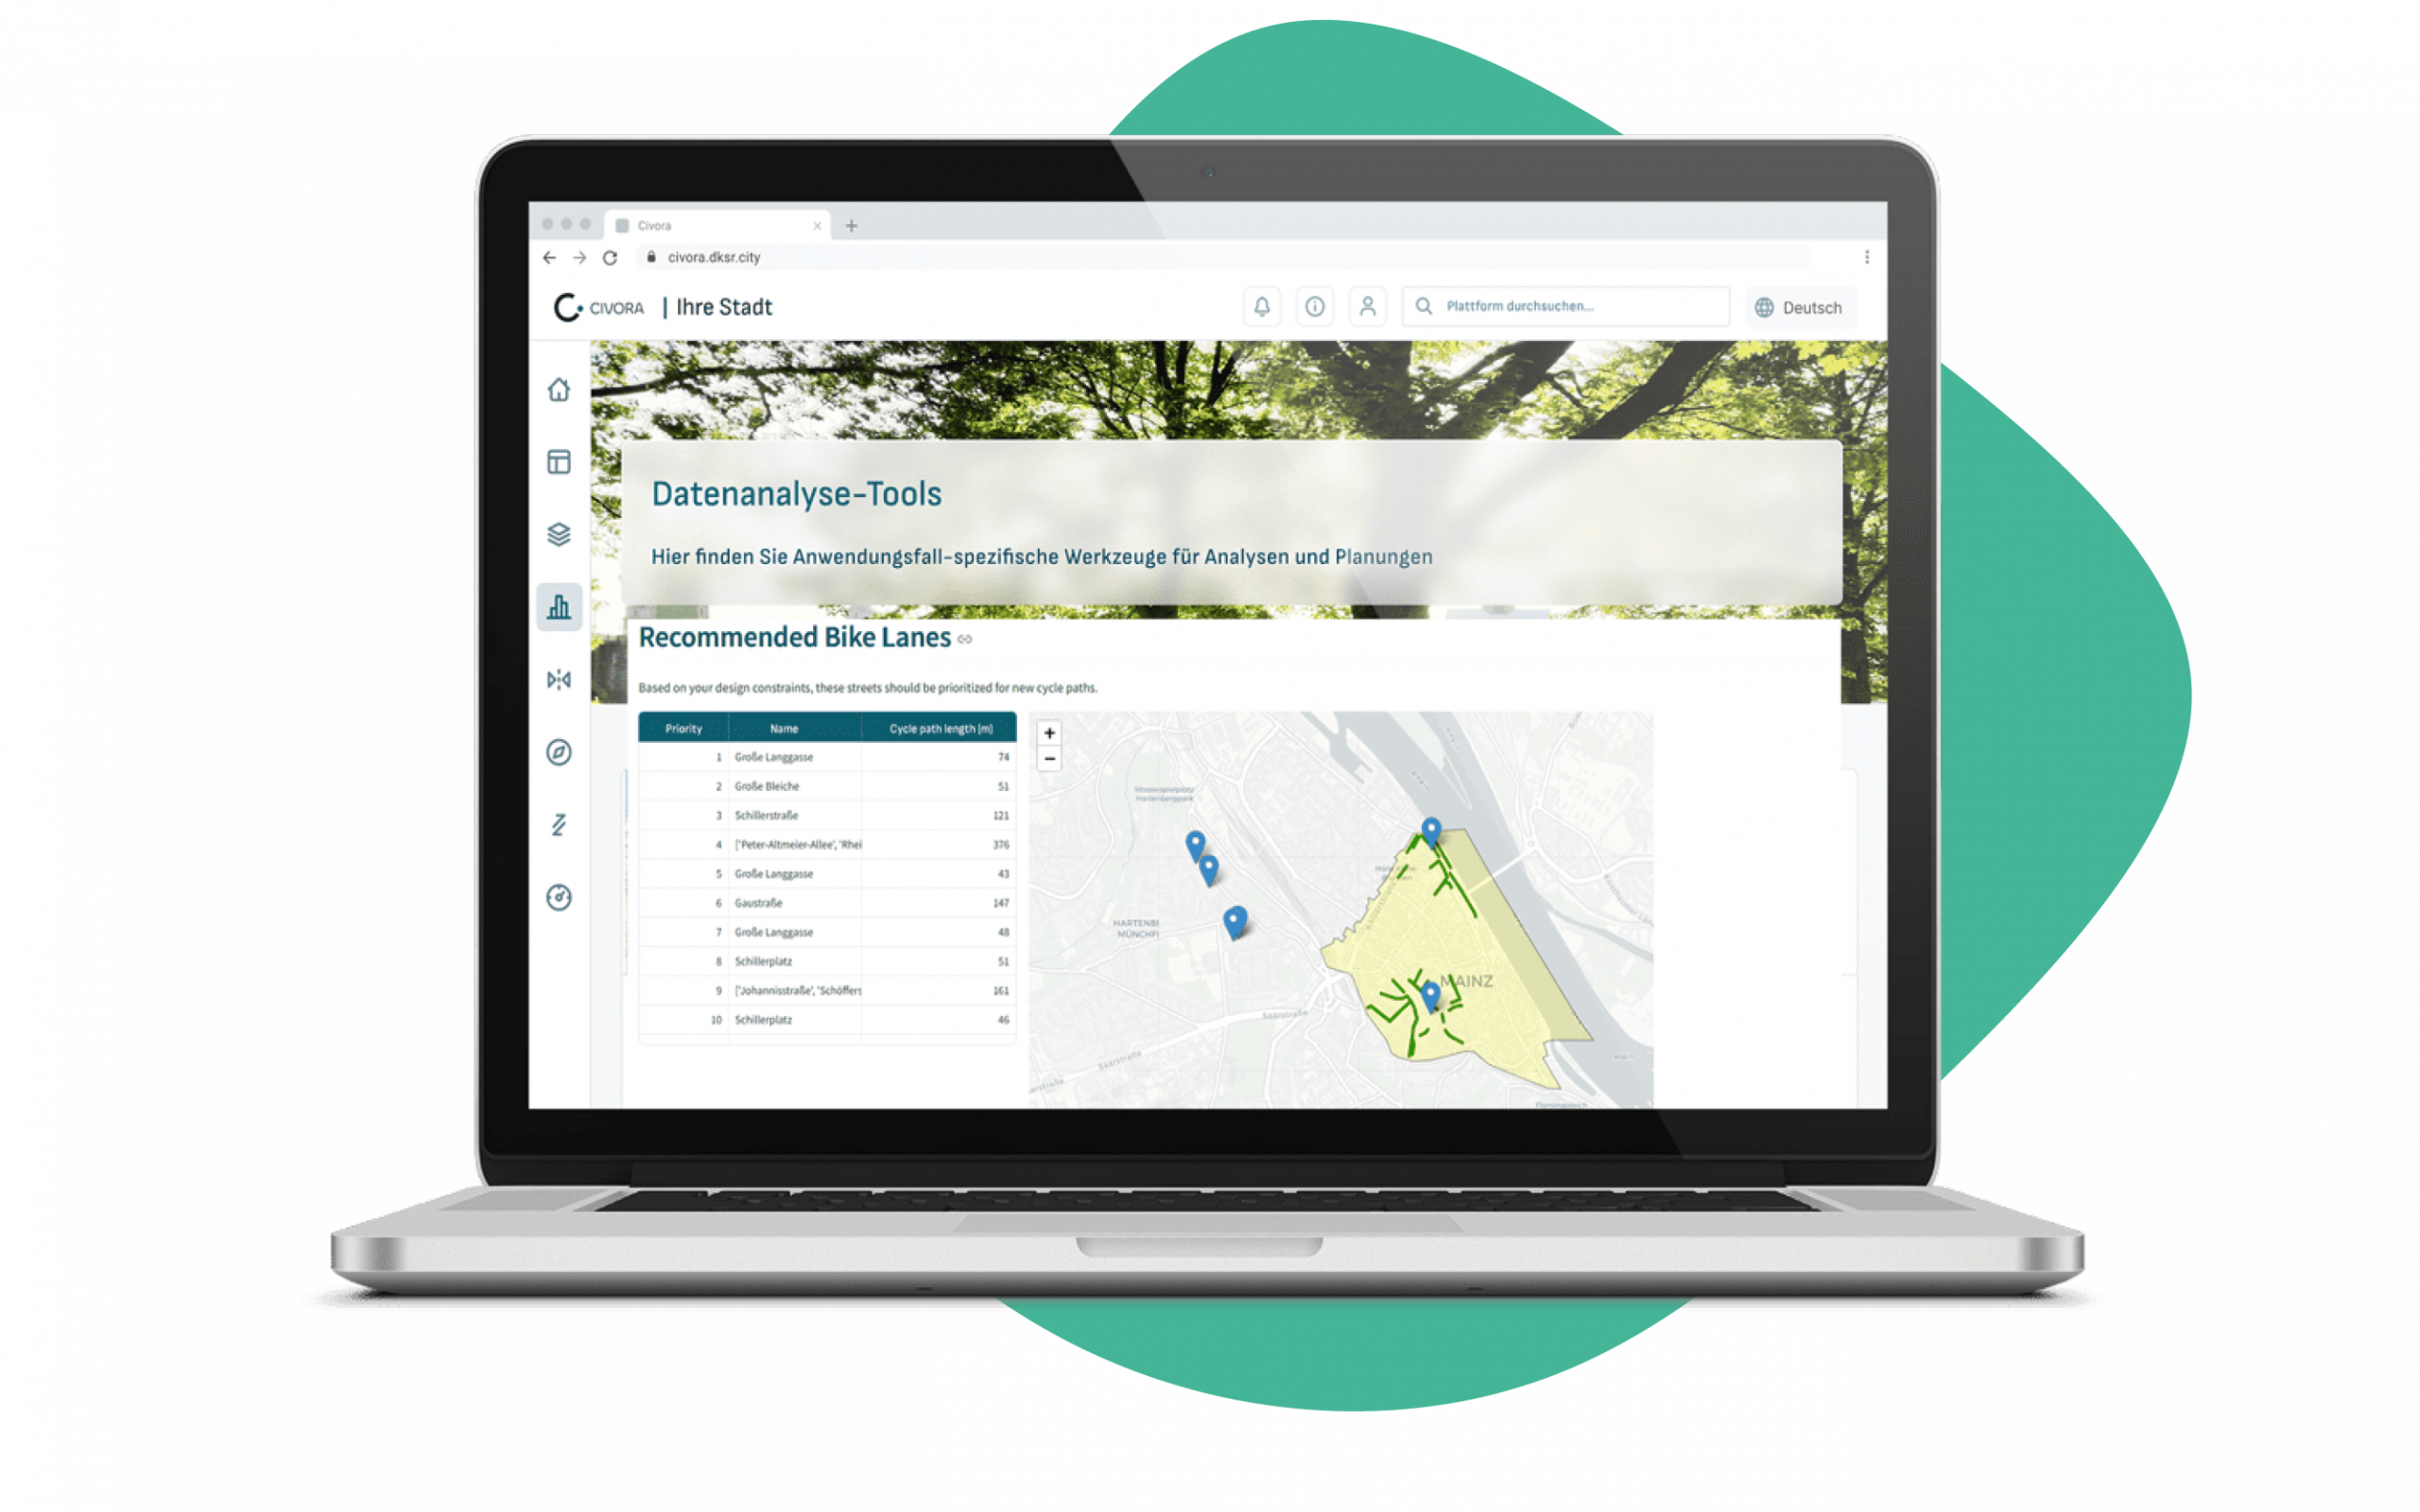
Bike Lane Planner
Use CaseSocial
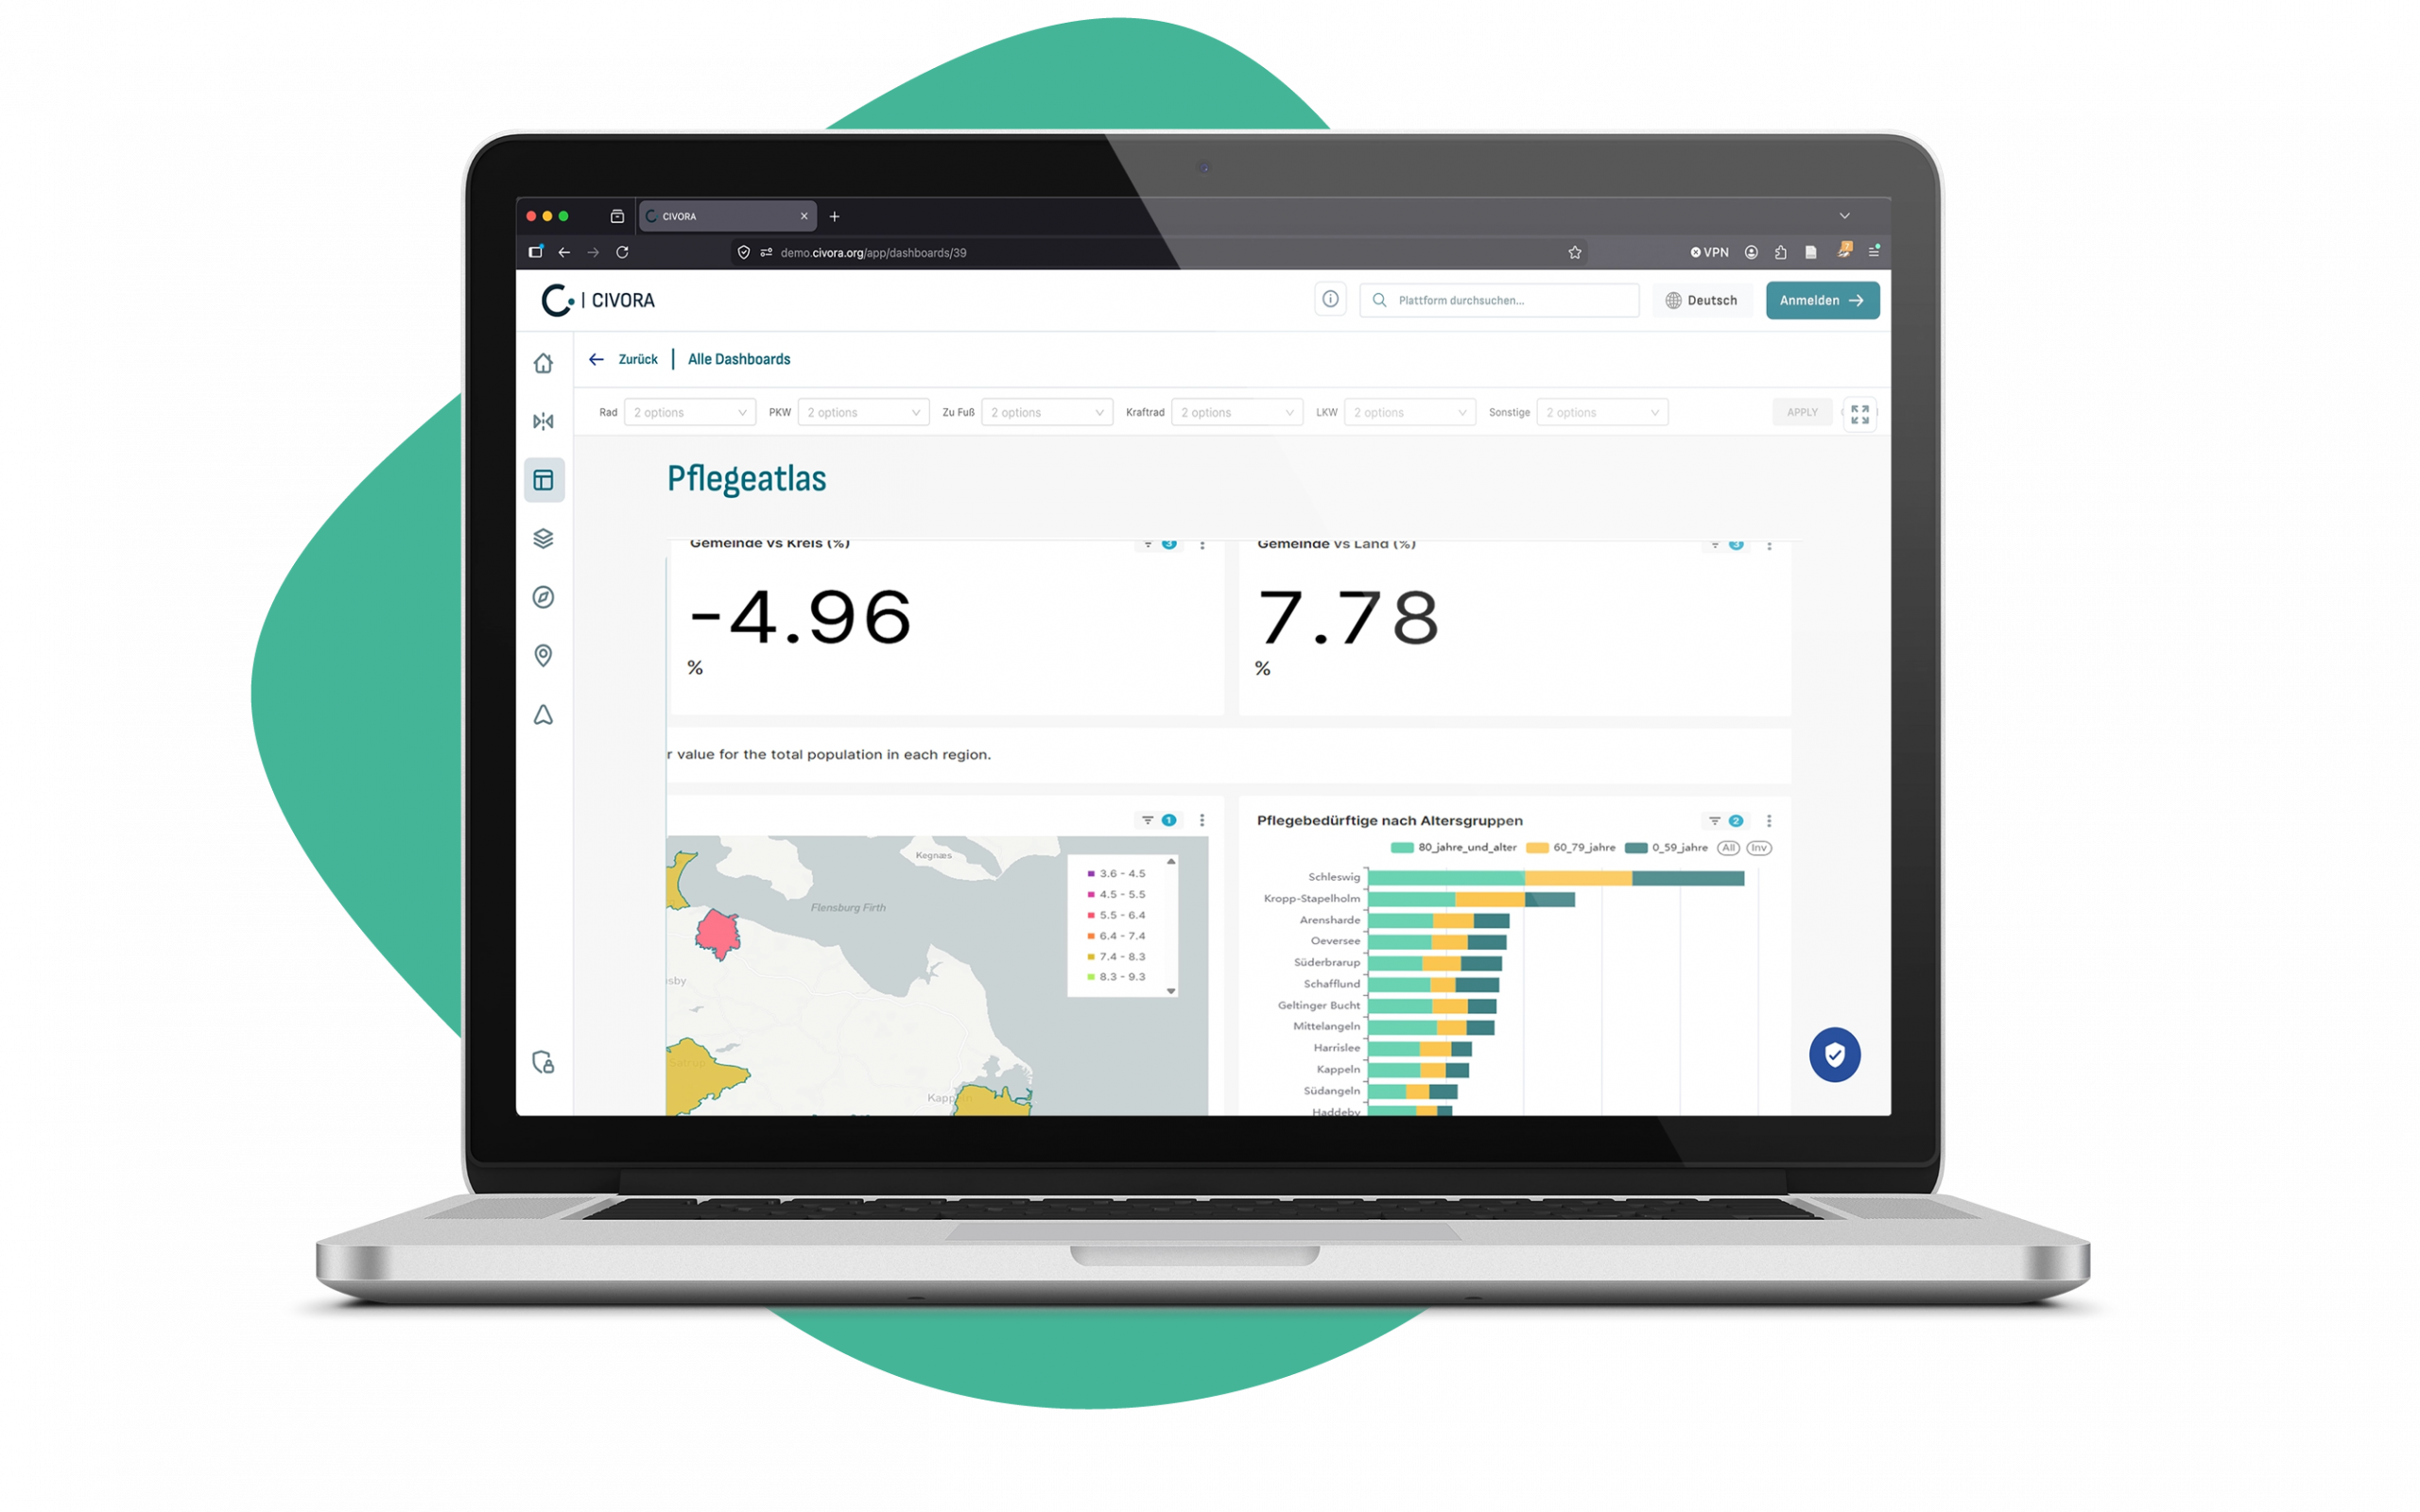
Care Atlas
Use Case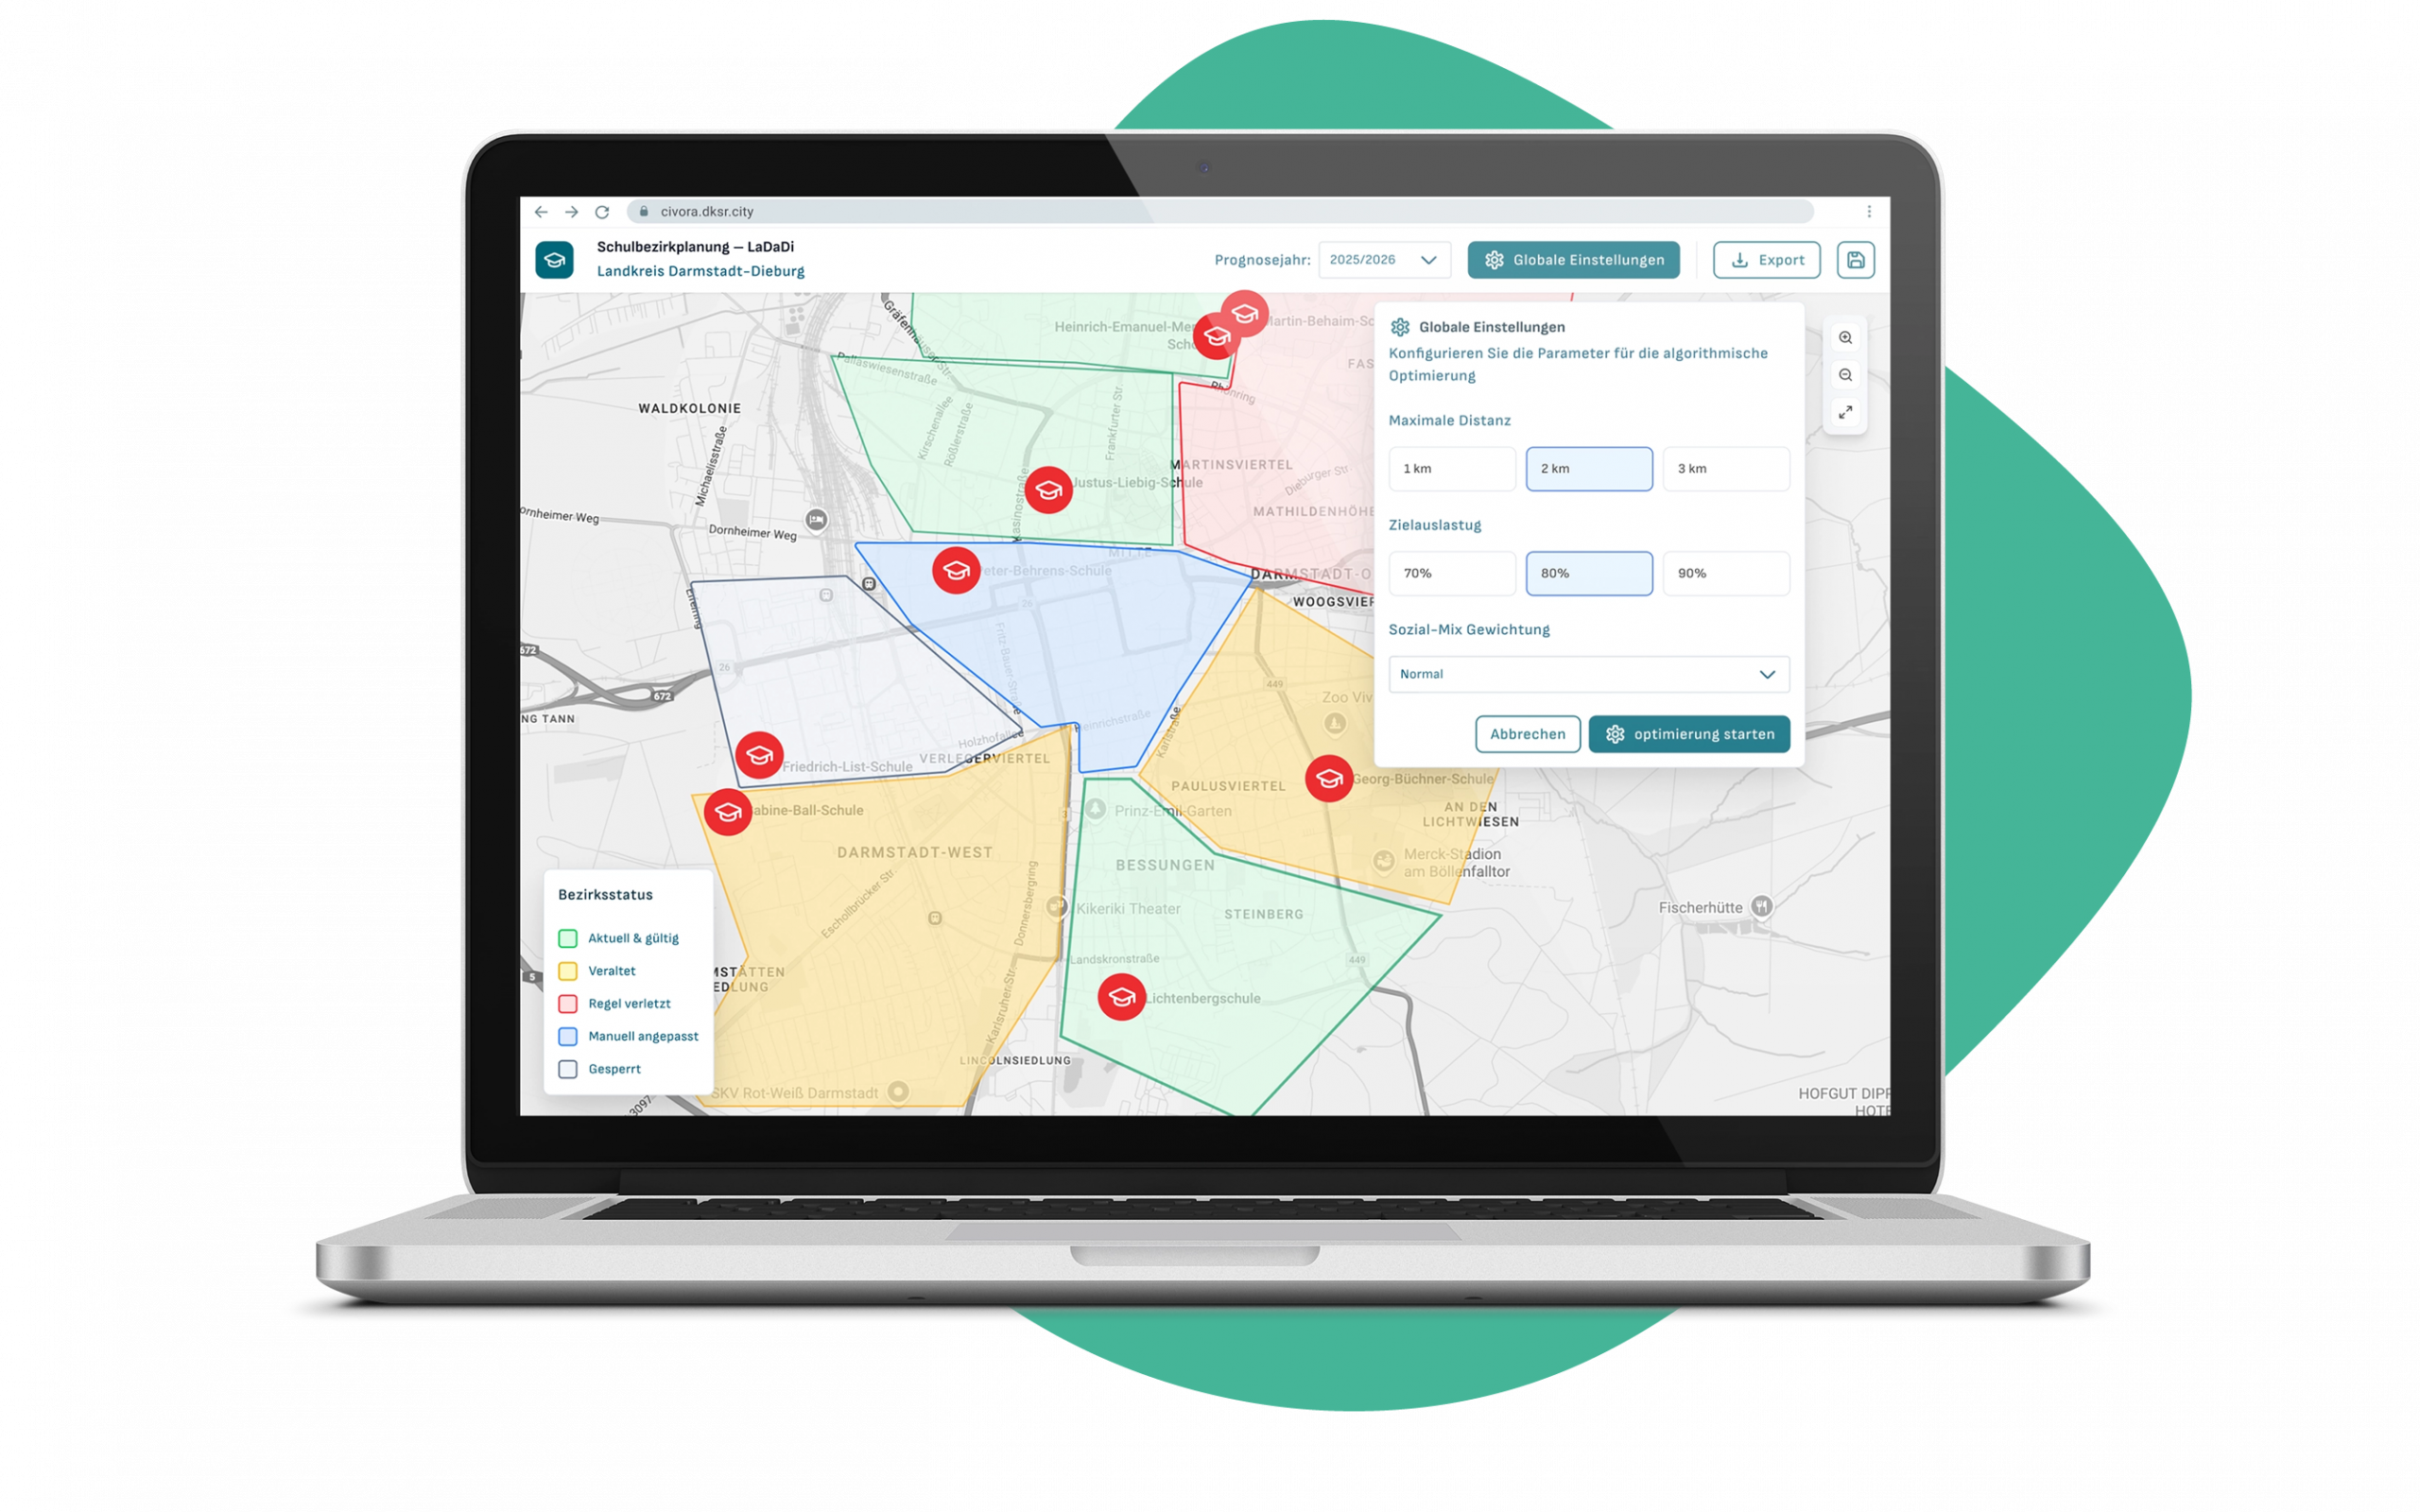
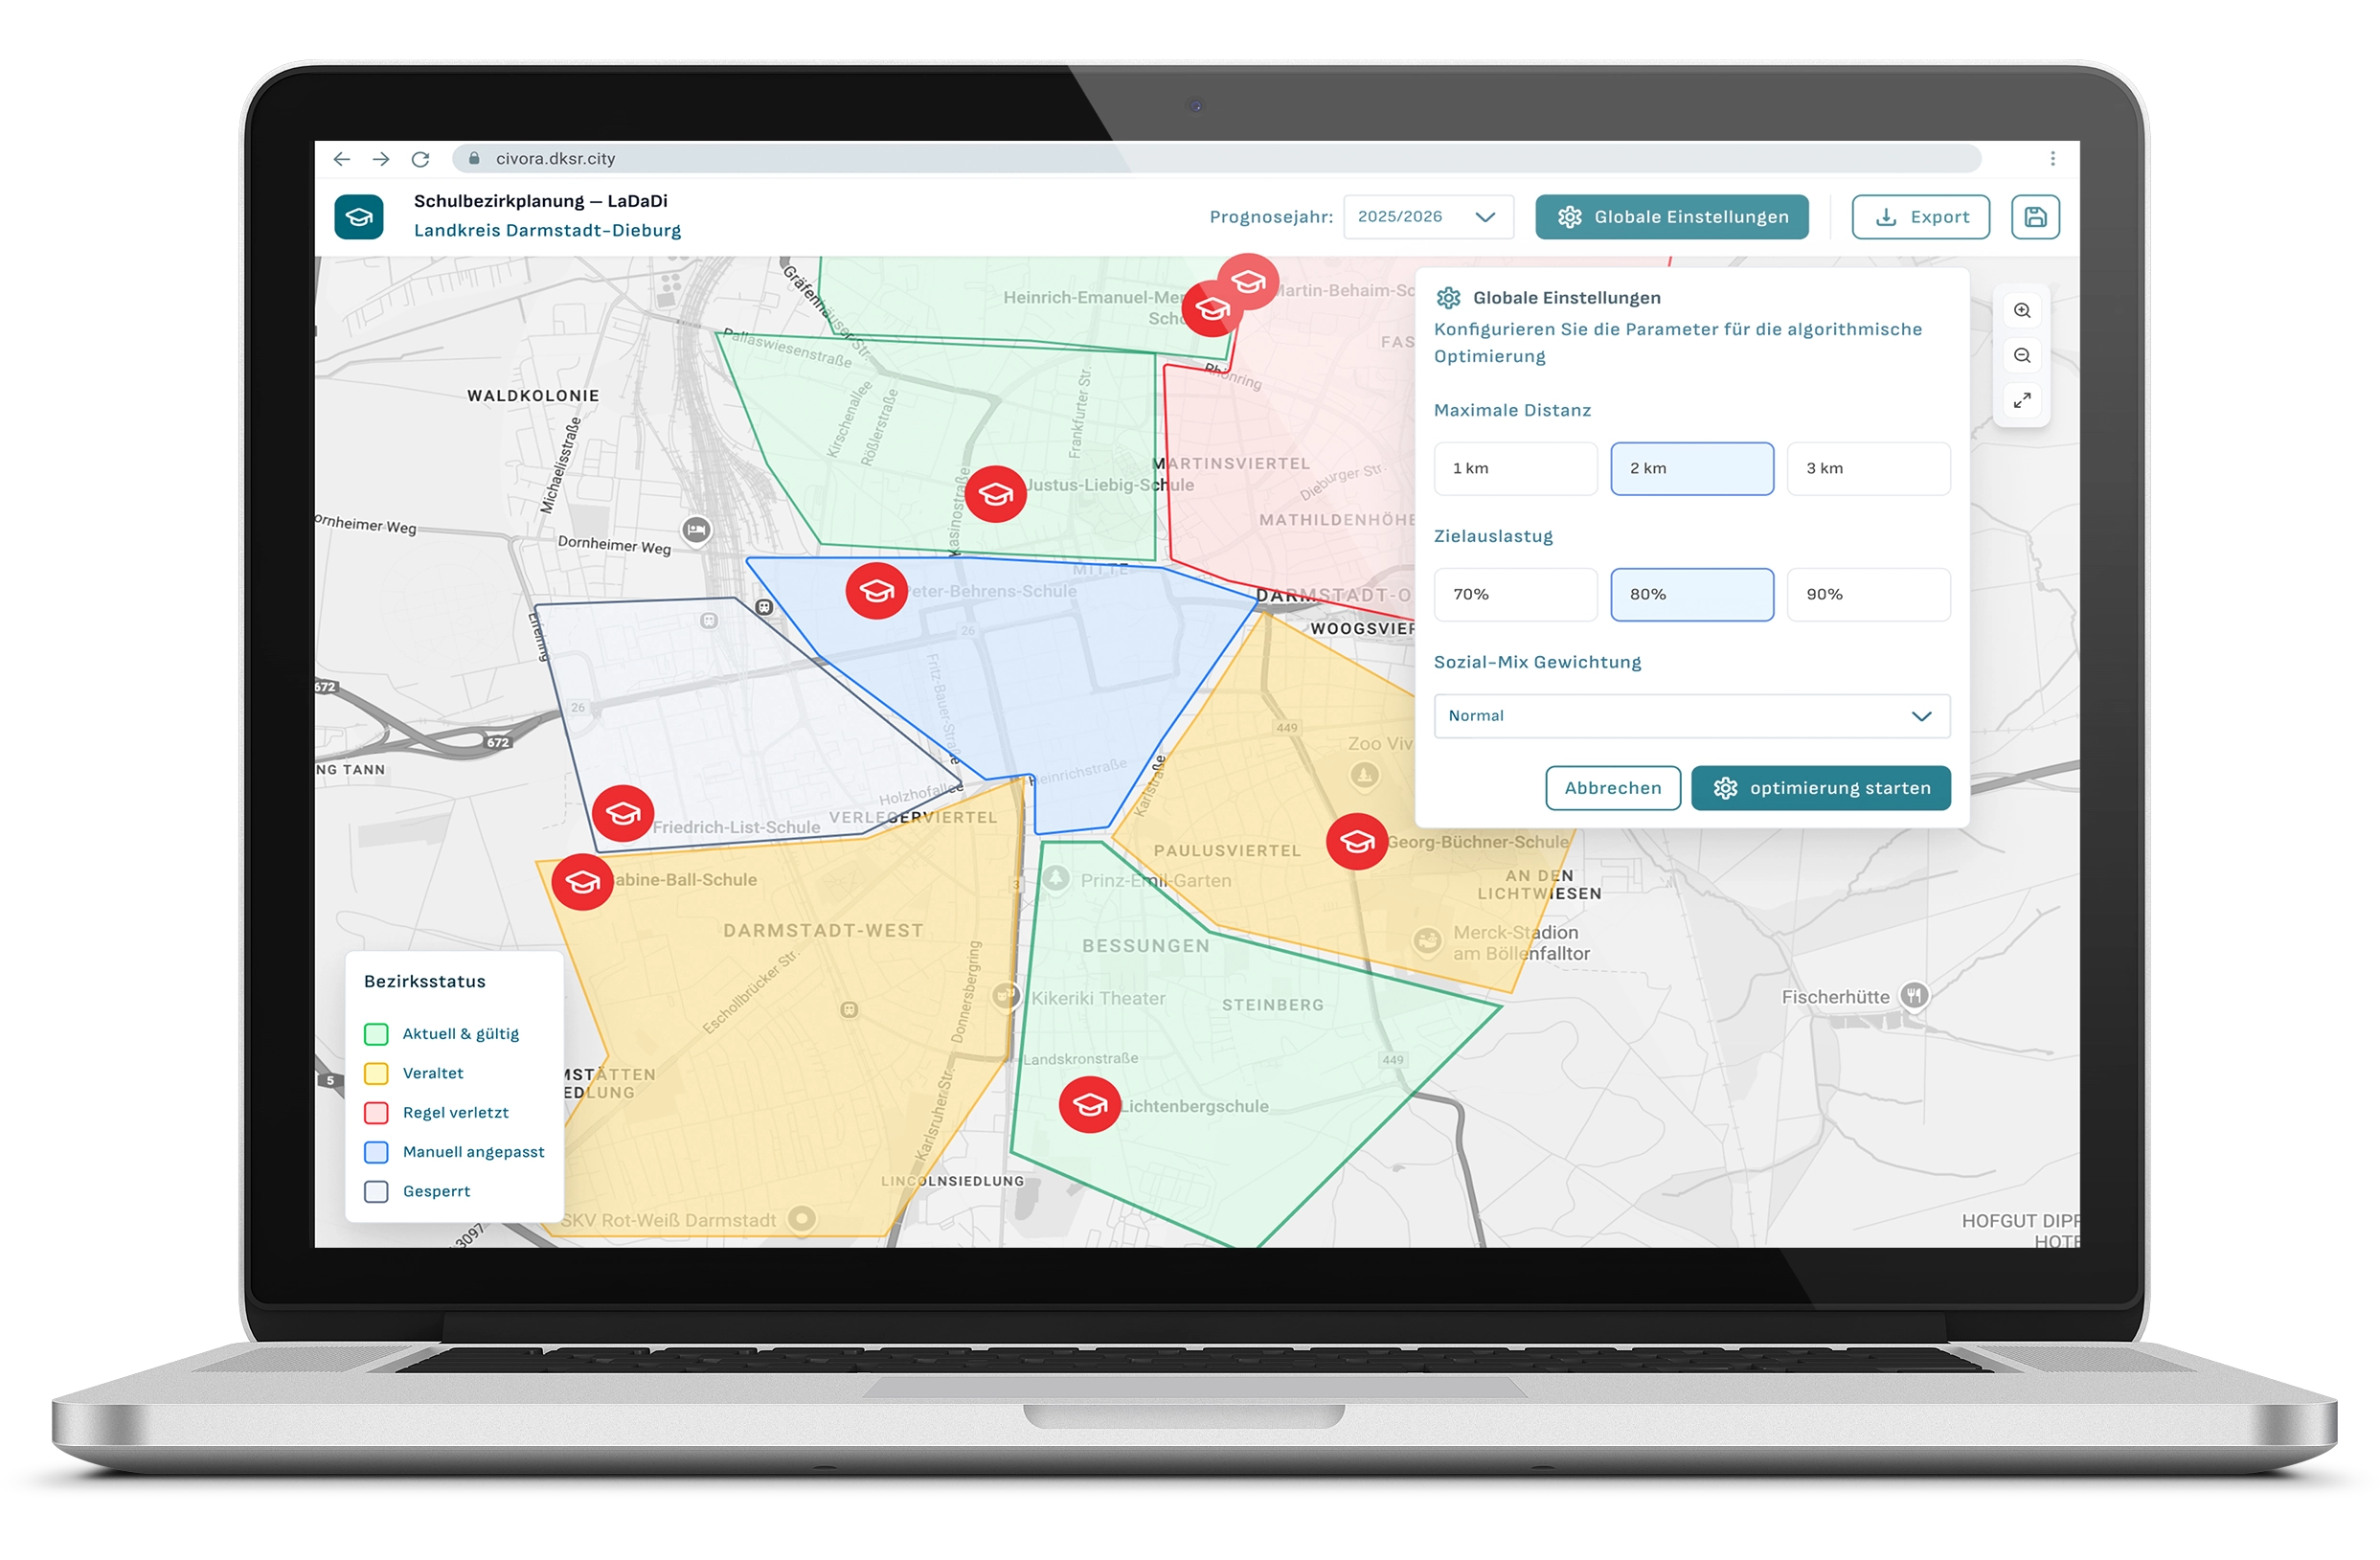
School District Planner
Use Case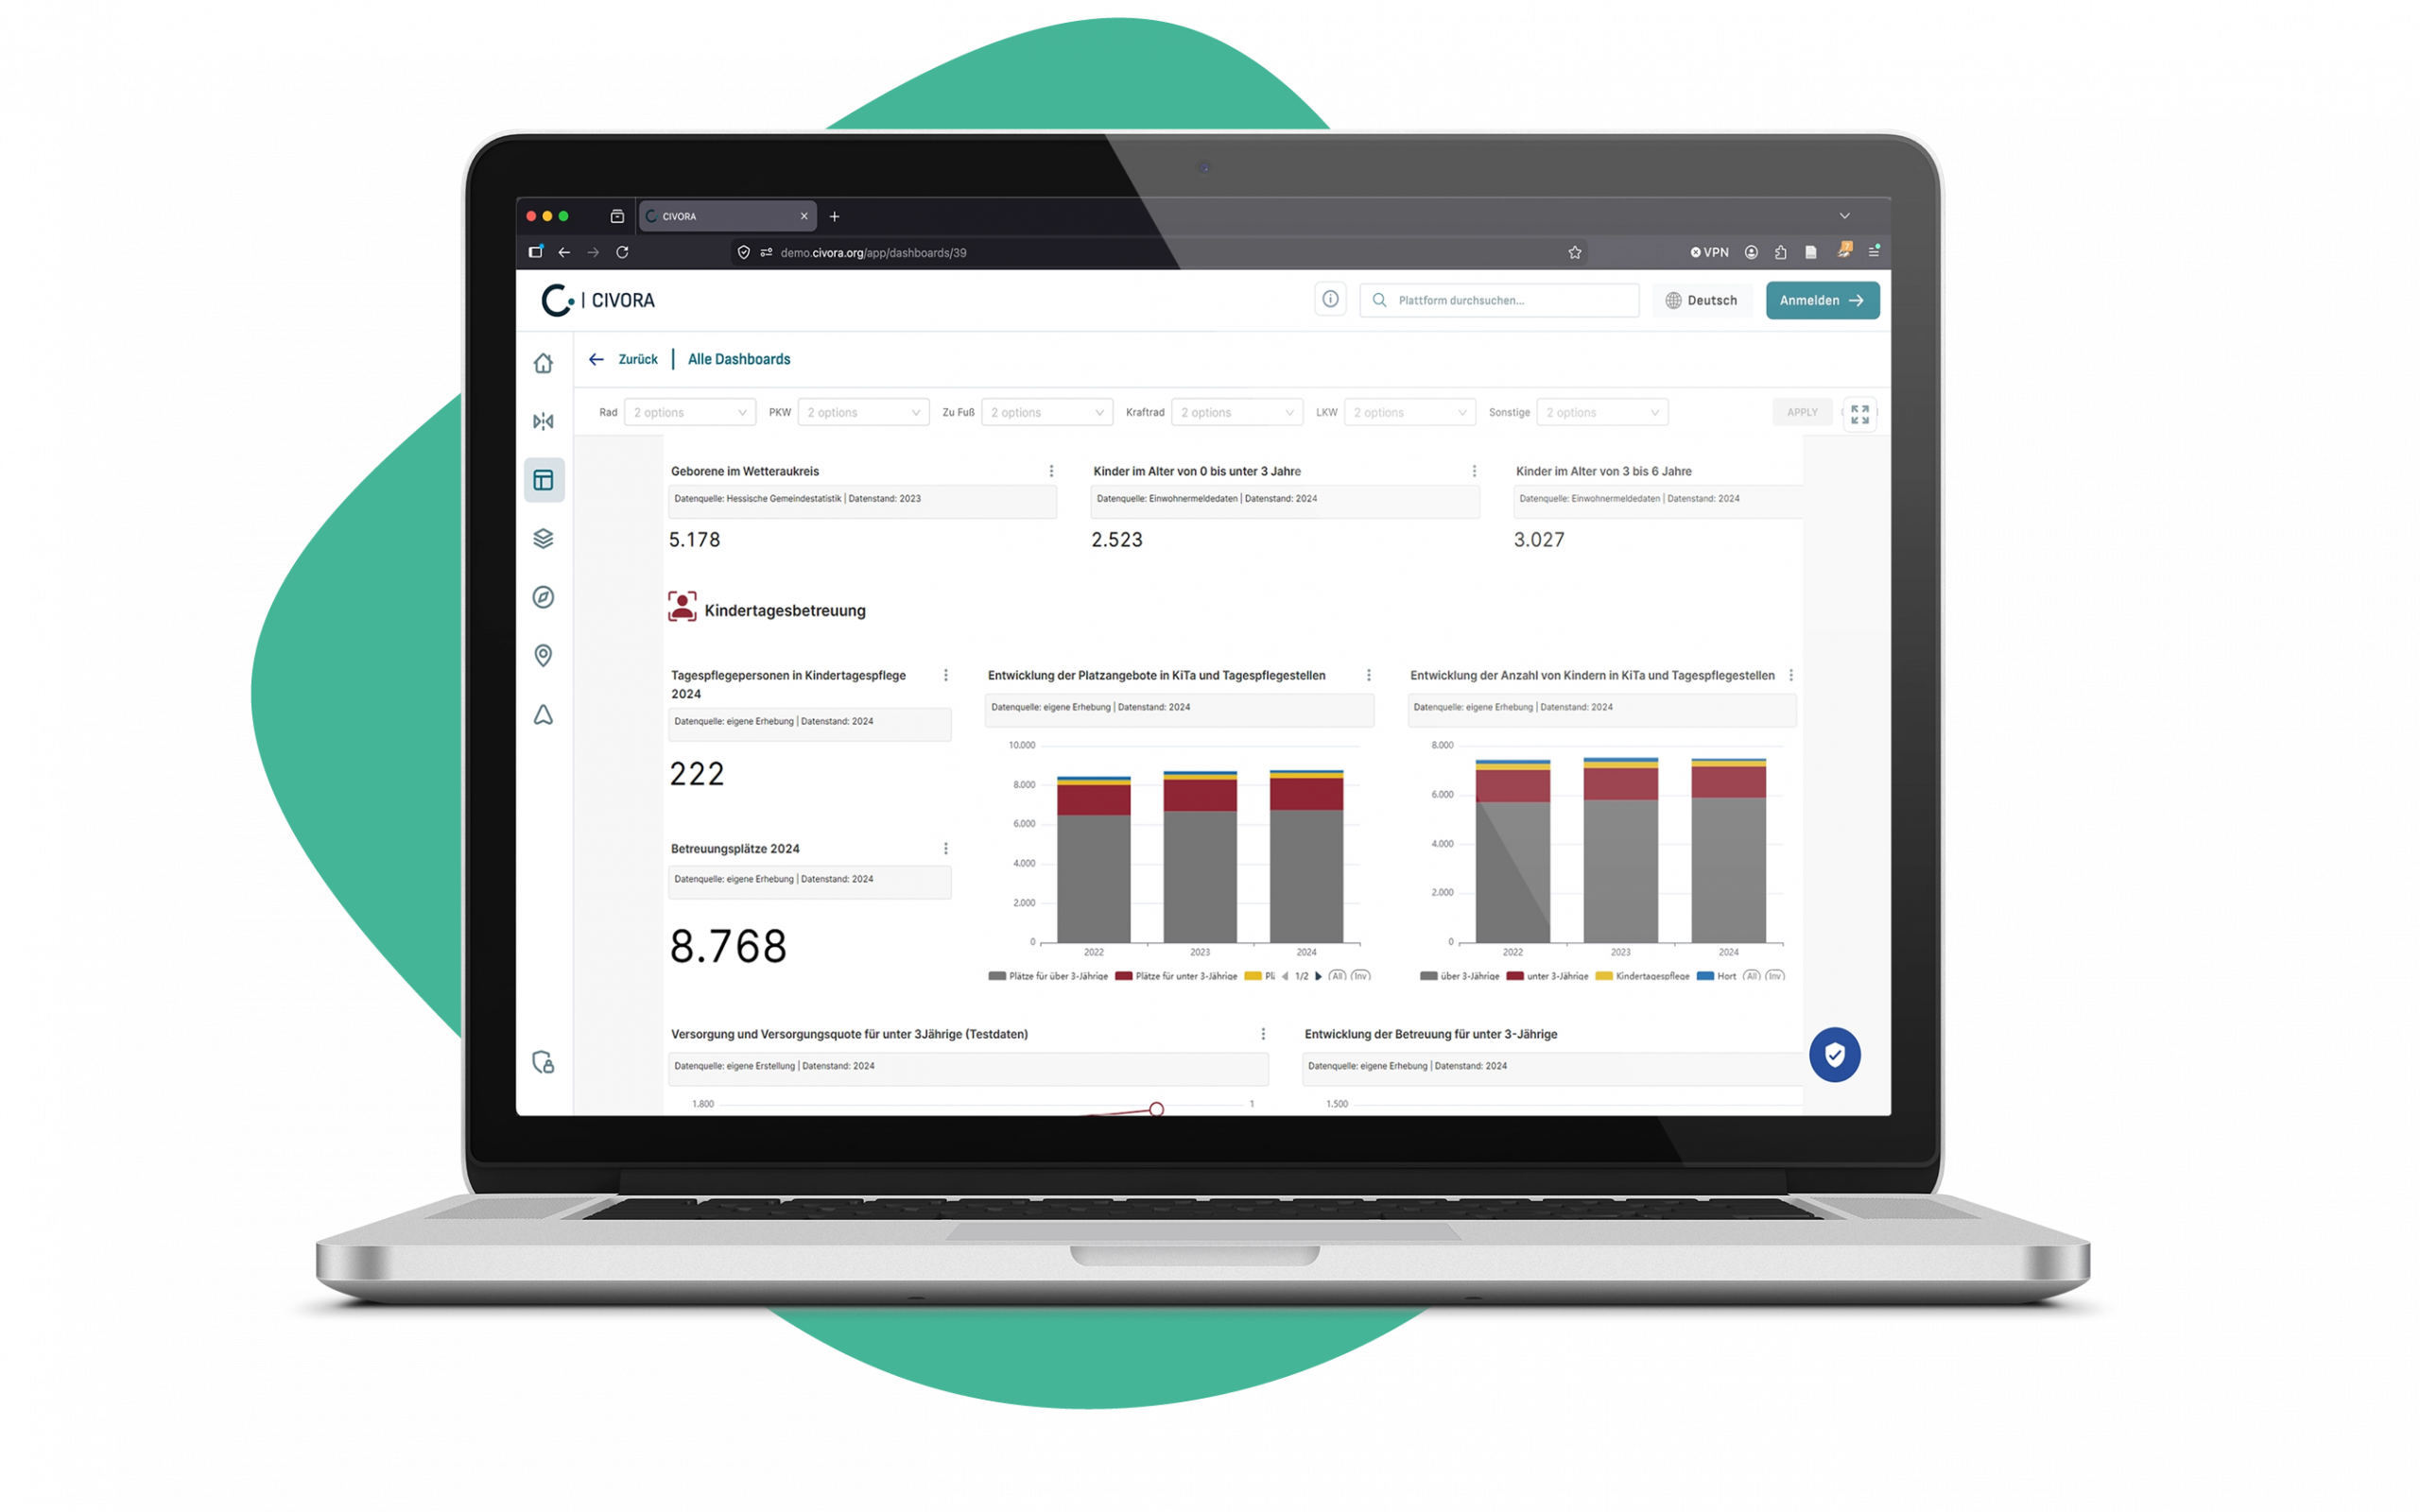
Automated Social Reports & Indices
Use CaseThis is just the beginning
CIVORA is always growing - new use cases and specialist applications are added regularly. Check back soon! Or take the demo for a spin and experience some use cases live in action.