
Turning data into interactive live maps
Where are rental bikes available? Where can I find a free parking spot? What leisure activities are there this weekend? Where can I go to cool off when it's hot?
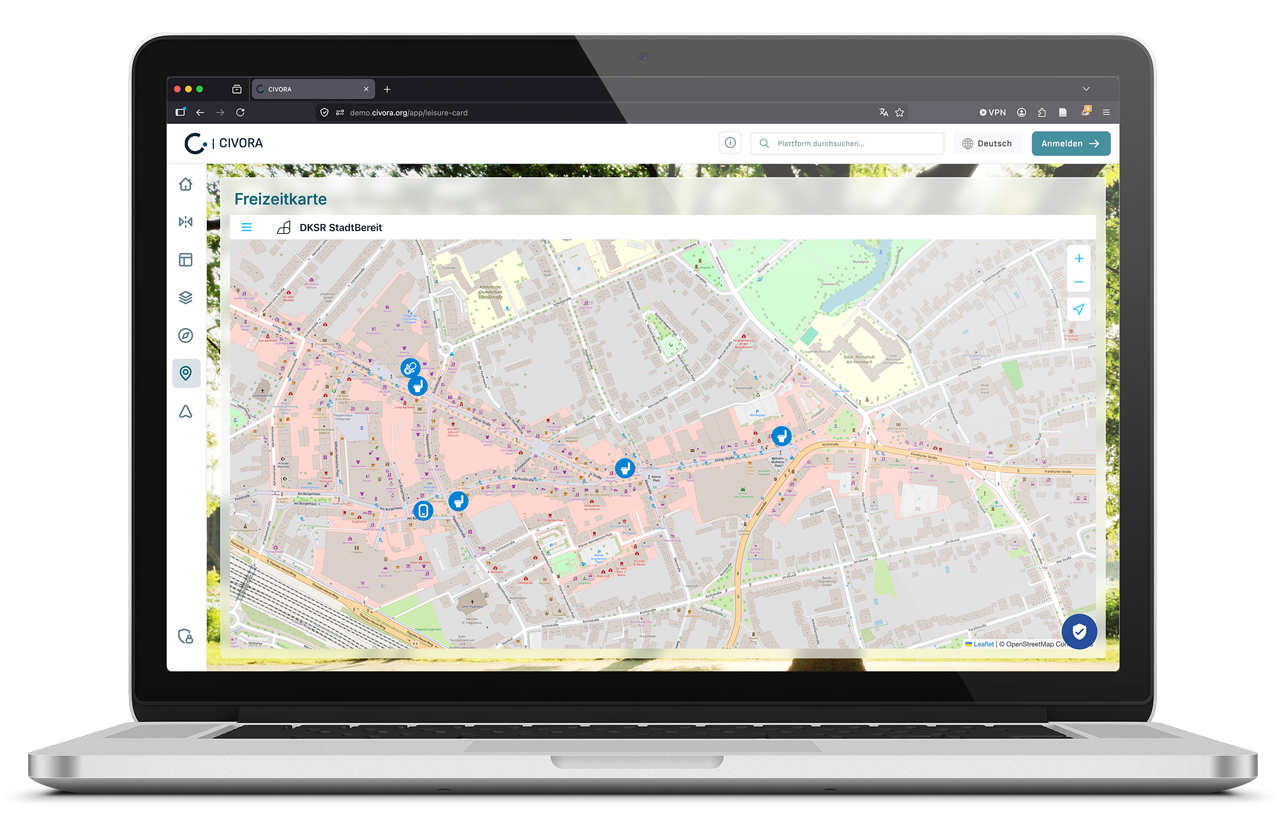
CIVORA's Stadtbereit live map module turns your data into interactive maps that answer these questions for residents, visitors, and your administration. The outcome: Your investments in mobility, climate adaptation, and infrastructure become visible and actionable.

Key benefits:

Customizable
Design maps to your exact specifications, including thematic views, filtering options, visual design, and additional information displayed – all fully customizable.

Flexible in Use
Stadtbereit meets your citizens where they are: in city apps on smartphones, on your municipal website, or on public info kiosks. It automatically adapts to each device.

For various target groups
Stadtbereit is built for citizens first – but works just as well for municipal staff: Which trees need watering? Where do the pipes run? What building data is available? One system, many use cases.
How do municipalities use Stadtbereit?
See it live here
Map applications for your municipality
Stadtbereit in action
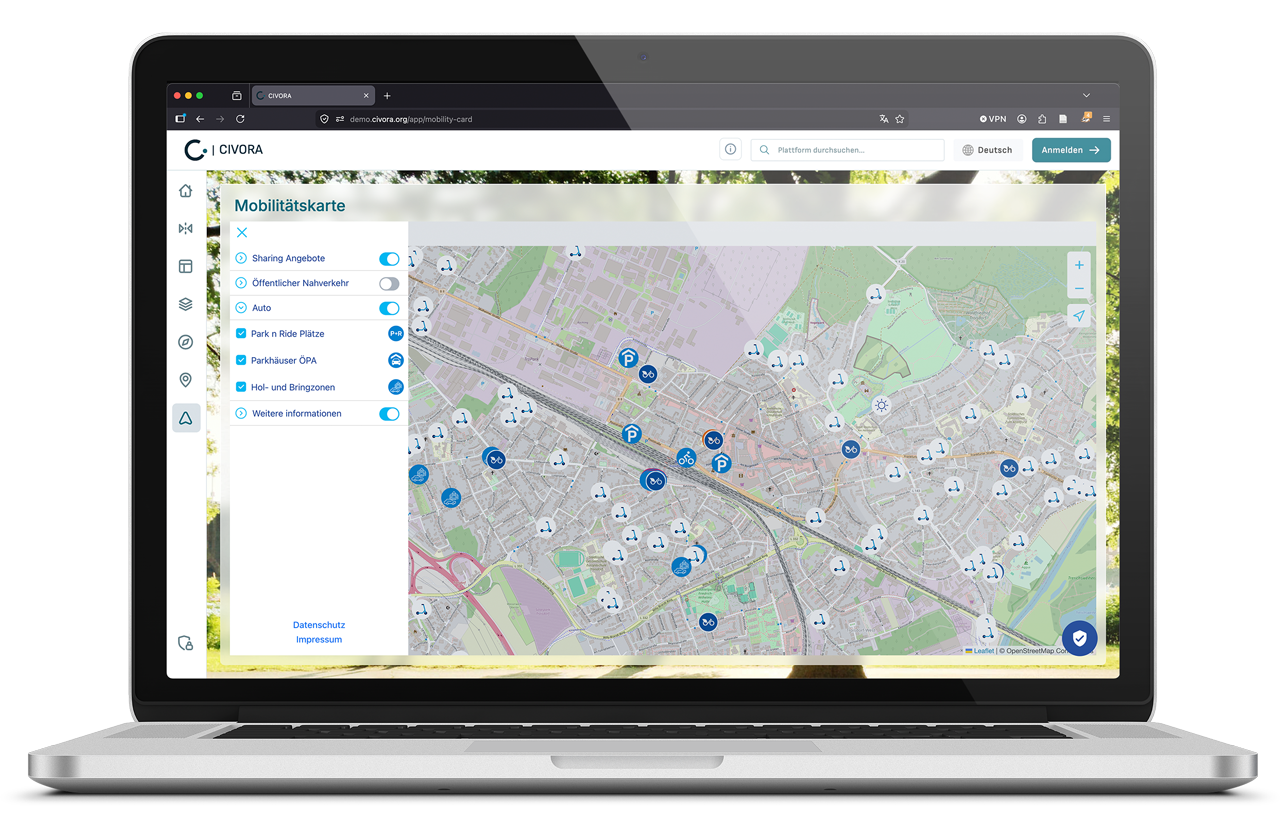
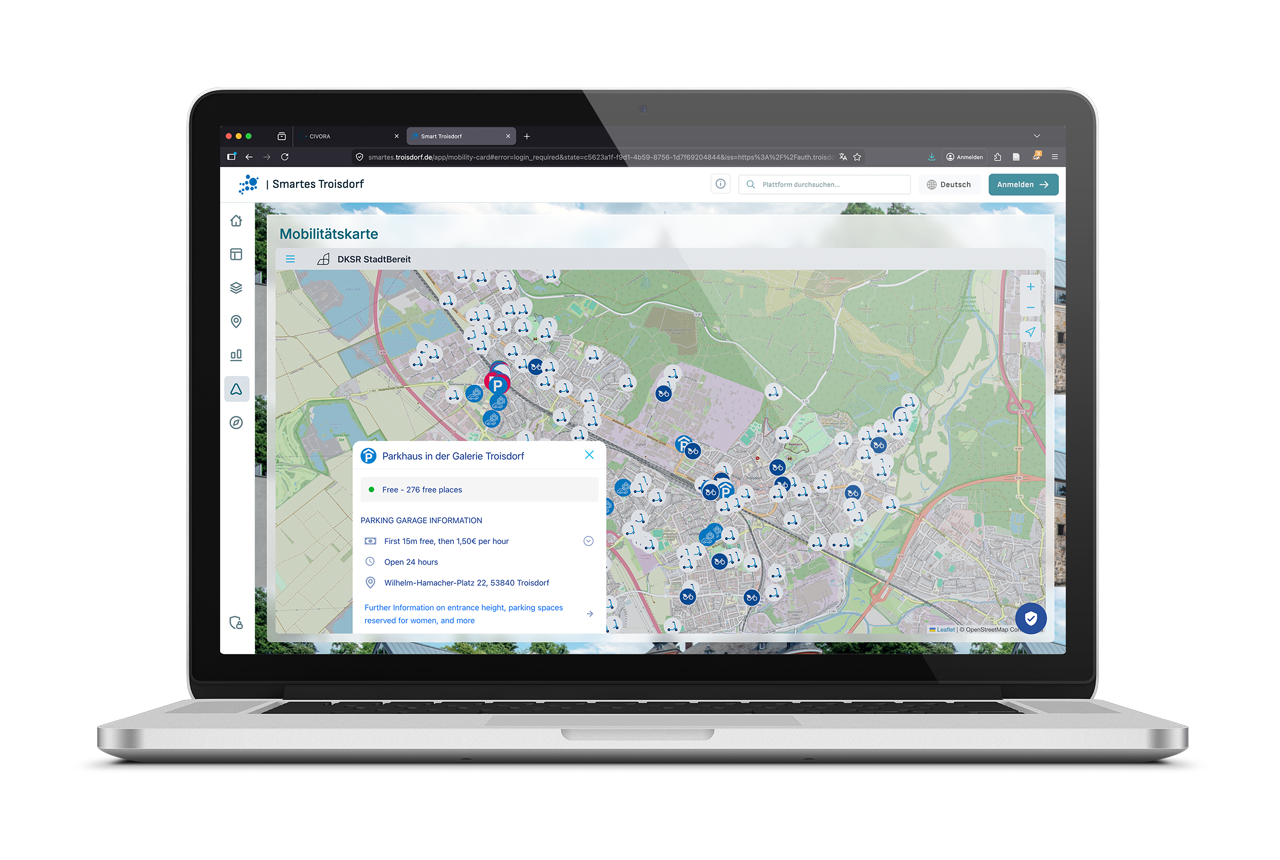
Mobility maps:
- Enabling seamless mobility – all services at a glance simplify switching between transport modes
- Showing live availability – available parking spots, charging stations, e-scooters and rental bikes in real time
- Direct links to booking – citizens can book straight from the map via links to provider apps and websites
- Maximizing sharing service usage – what's visible and bookable gets used more
- Making space for the city and the climate – more shared mobility means less parking pressure, fewer CO₂ emissions, and more room for urban development

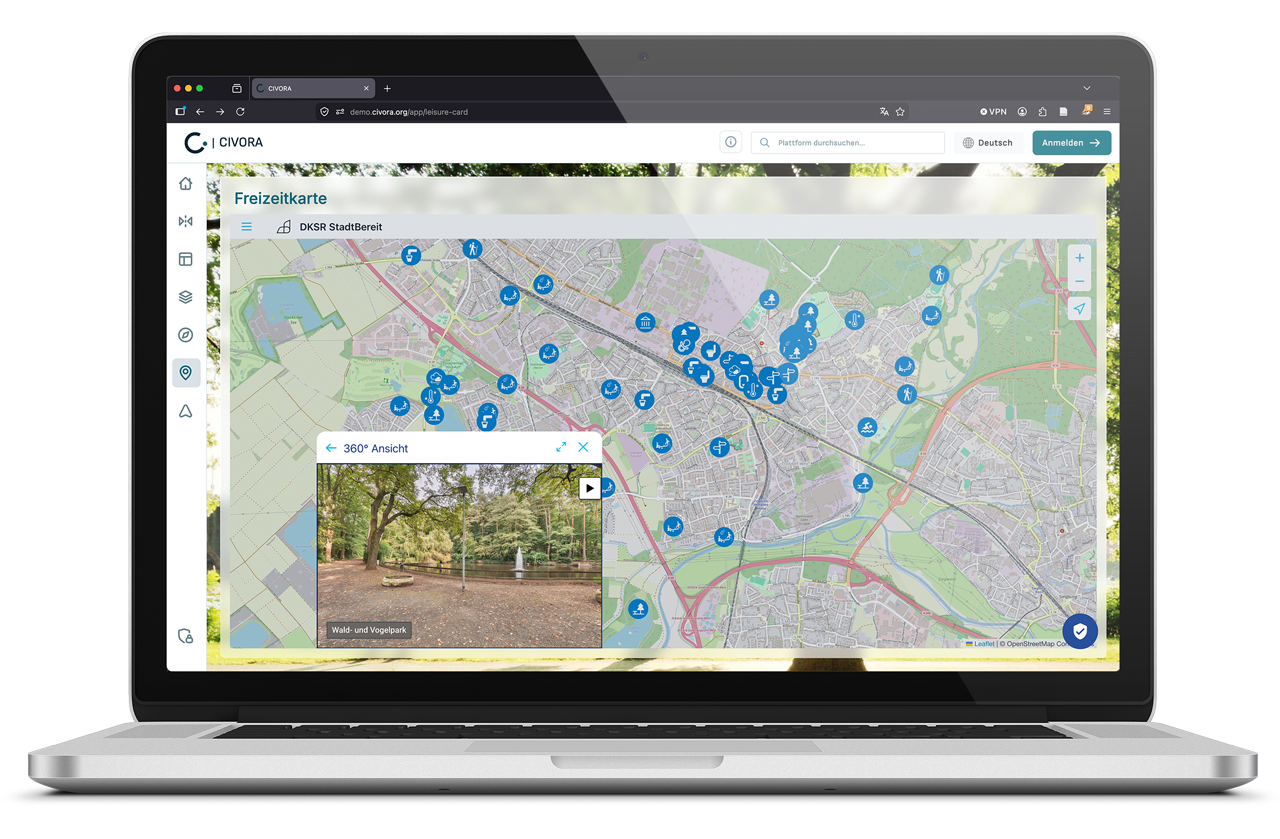
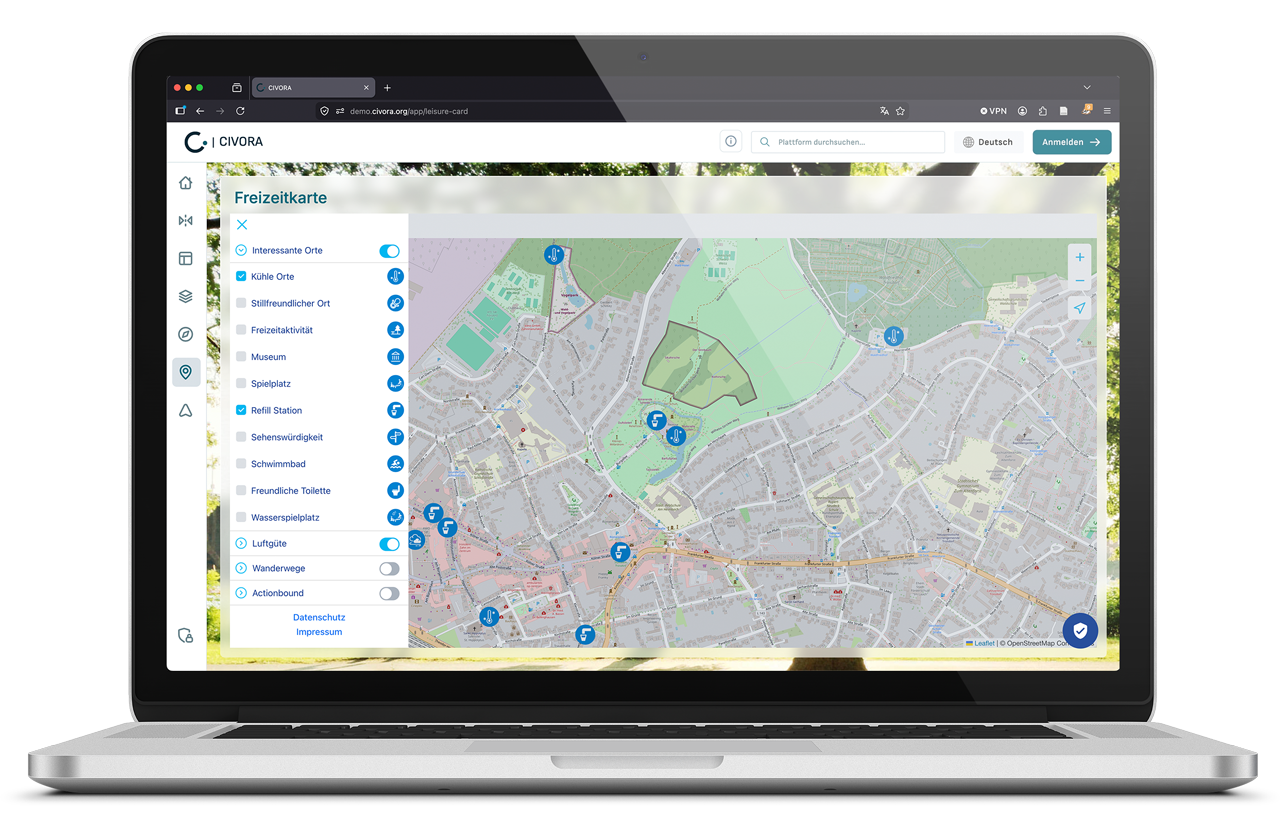
climate and heat maps
- Protecting vulnerable groups – quickly finding drinking fountains, shaded spots and air-conditioned spaces during heat waves
- Visualizing climate action – show which adaptation measures you have already implemented
- Informing in real time – air quality, temperature or water levels live on the map
- Raising climate awareness – citizens can clearly see where and how their municipality is taking climate action
- Building trust – transparency about climate measures shows your municipality is taking action
Stadtbereit can be used as a standalone solution or as a CIVORA module. See it live now.
See it live here
Collect data, build dashboards, and share results – try CIVORA for yourself. Four weeks, free and non-binding, GDPR-compliant, and no IT changes required.
Try CIVORA for free